Track maps
Charley developed from Tropical Depression Three in the Caribbean Sea.
 Charley track on SST image of Atlantic Ocean from 11 August (270 Kb) This
image represents the average composite sea surface temperature (SST) derived
from NOAA satellite AVHRR data over the 7 days ending 11 August 2004. The
averaging is done to remove clouds. The temperature scale for SST is
20C to 32C. The track of Charley is overlaid on this image.
Charley track on SST image of Atlantic Ocean from 11 August (270 Kb) This
image represents the average composite sea surface temperature (SST) derived
from NOAA satellite AVHRR data over the 7 days ending 11 August 2004. The
averaging is done to remove clouds. The temperature scale for SST is
20C to 32C. The track of Charley is overlaid on this image.
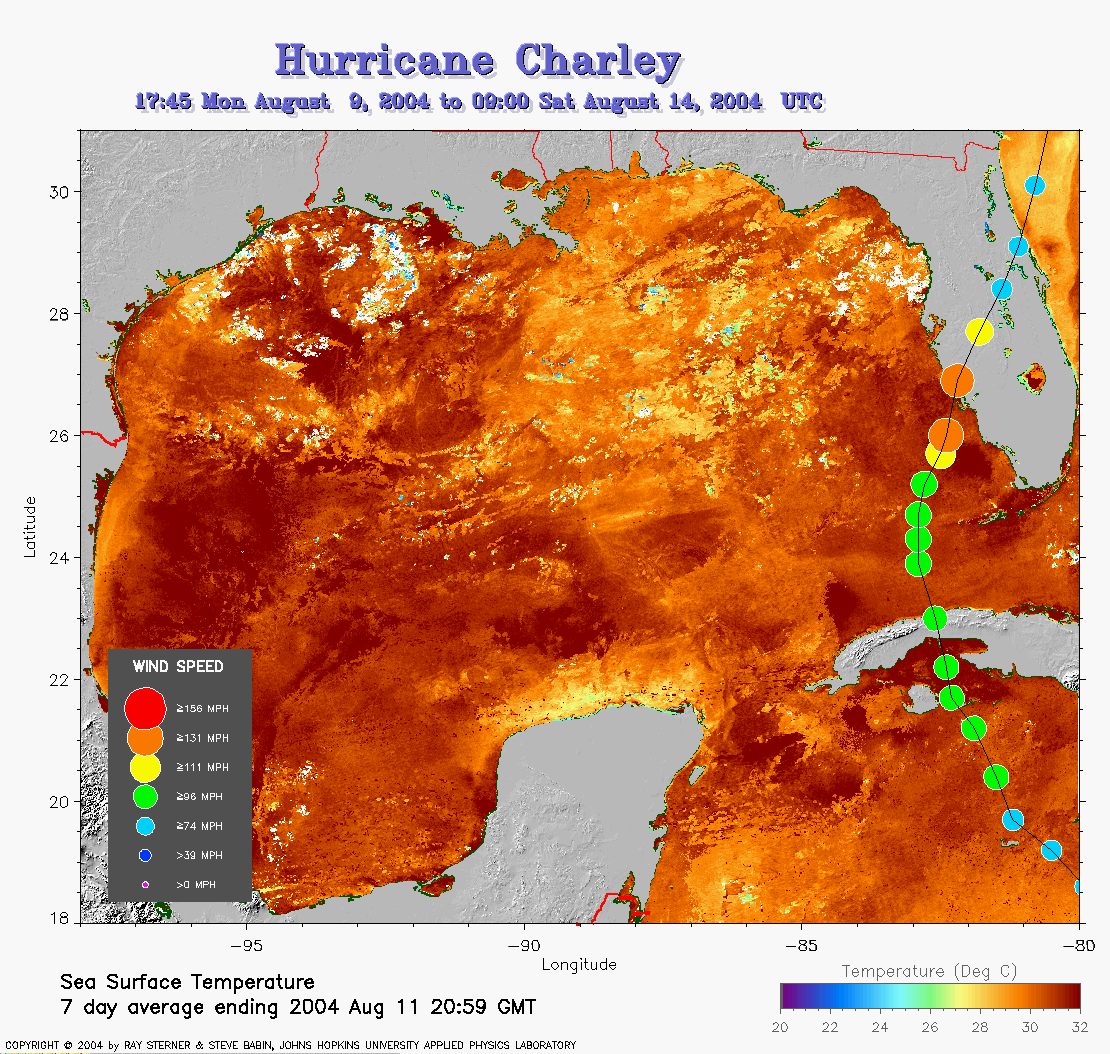 Charley track on SST image of Gulf of Mexico from 11 August (338 Kb) This
image represents the average composite sea surface temperature (SST) derived
from NOAA satellite AVHRR data over the 7 days ending 11 August 2004. The
averaging is done to remove clouds. The temperature scale for SST is
20C to 32C. The track of Charley is overlaid on this image. Note the wake
of cooler SSTs left by the previous passage of Tropical Storm Bonnie.
Charley track on SST image of Gulf of Mexico from 11 August (338 Kb) This
image represents the average composite sea surface temperature (SST) derived
from NOAA satellite AVHRR data over the 7 days ending 11 August 2004. The
averaging is done to remove clouds. The temperature scale for SST is
20C to 32C. The track of Charley is overlaid on this image. Note the wake
of cooler SSTs left by the previous passage of Tropical Storm Bonnie.
 NWS Radar image showing eye at 12:59 UT on 13 August (45Kb)
Track file
Track data (lat/lon, winds, etc.) in a text file.