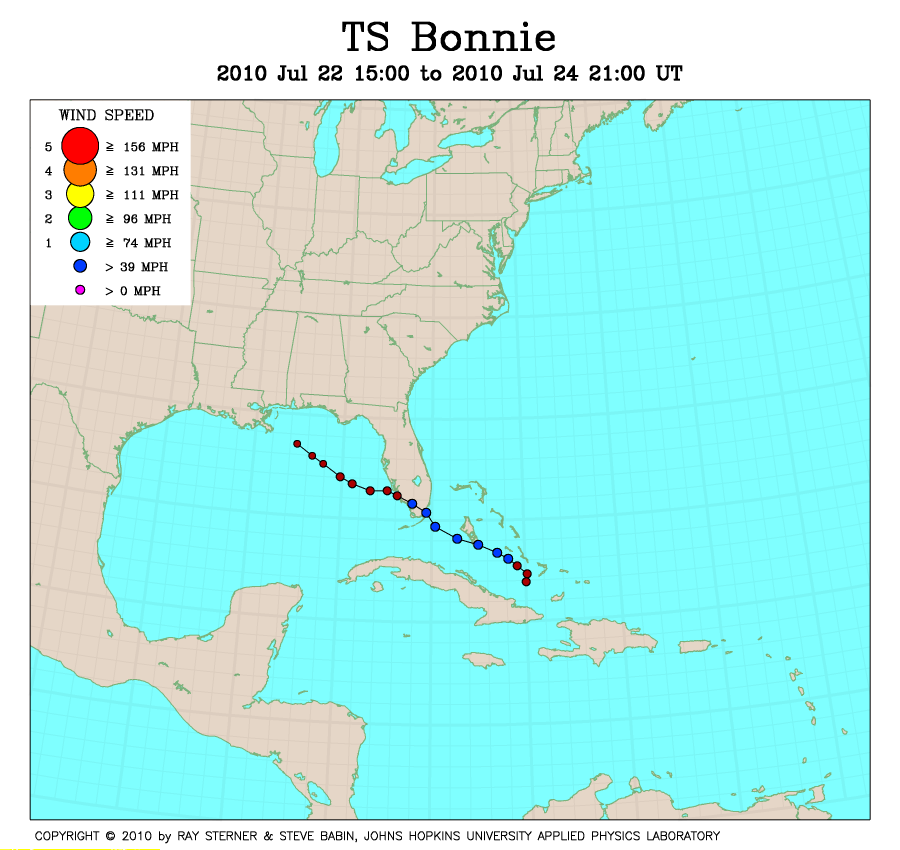
Track maps
Bonnie developed from Tropical Depression Three in the western Atlantic Ocean near the Bahamas.
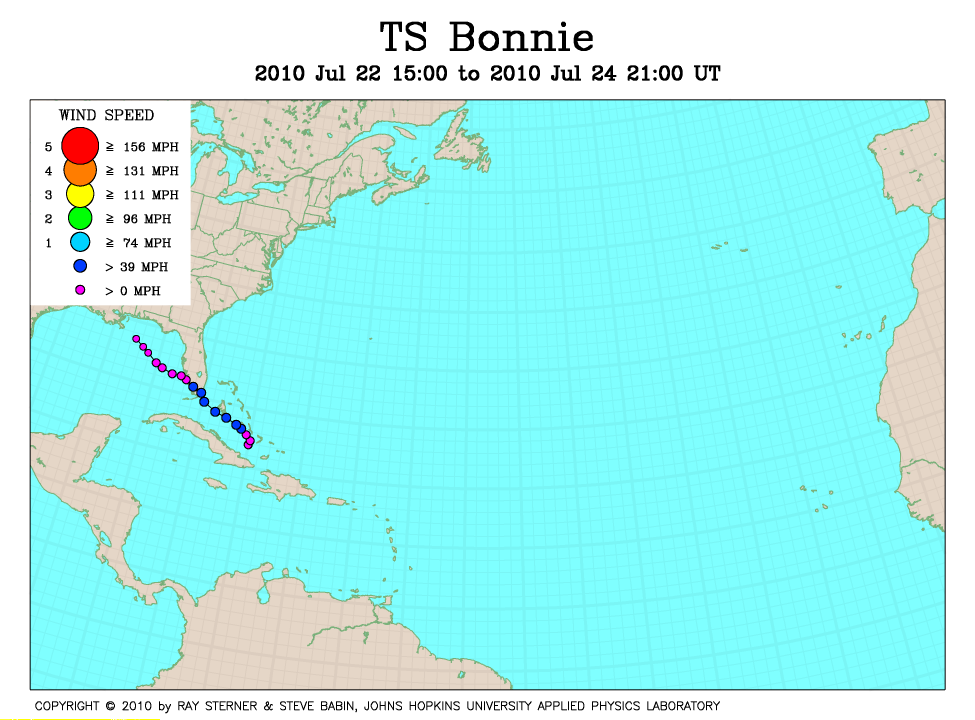
 Bonnie track on Atlantic Ocean SST image of 22 July (266 Kb) This image
represents the average composite sea surface temperature (SST) derived from
NOAA satellite AVHRR data over the 7 days ending 22 July 2010. The
averaging is done to remove clouds. The streaking artifacts are due to problems with the NOAA-17 satellite data. The temperature scale for SST is
20C to 32C. The track of Bonnie is overlaid on this image.
Bonnie track on Atlantic Ocean SST image of 22 July (266 Kb) This image
represents the average composite sea surface temperature (SST) derived from
NOAA satellite AVHRR data over the 7 days ending 22 July 2010. The
averaging is done to remove clouds. The streaking artifacts are due to problems with the NOAA-17 satellite data. The temperature scale for SST is
20C to 32C. The track of Bonnie is overlaid on this image.
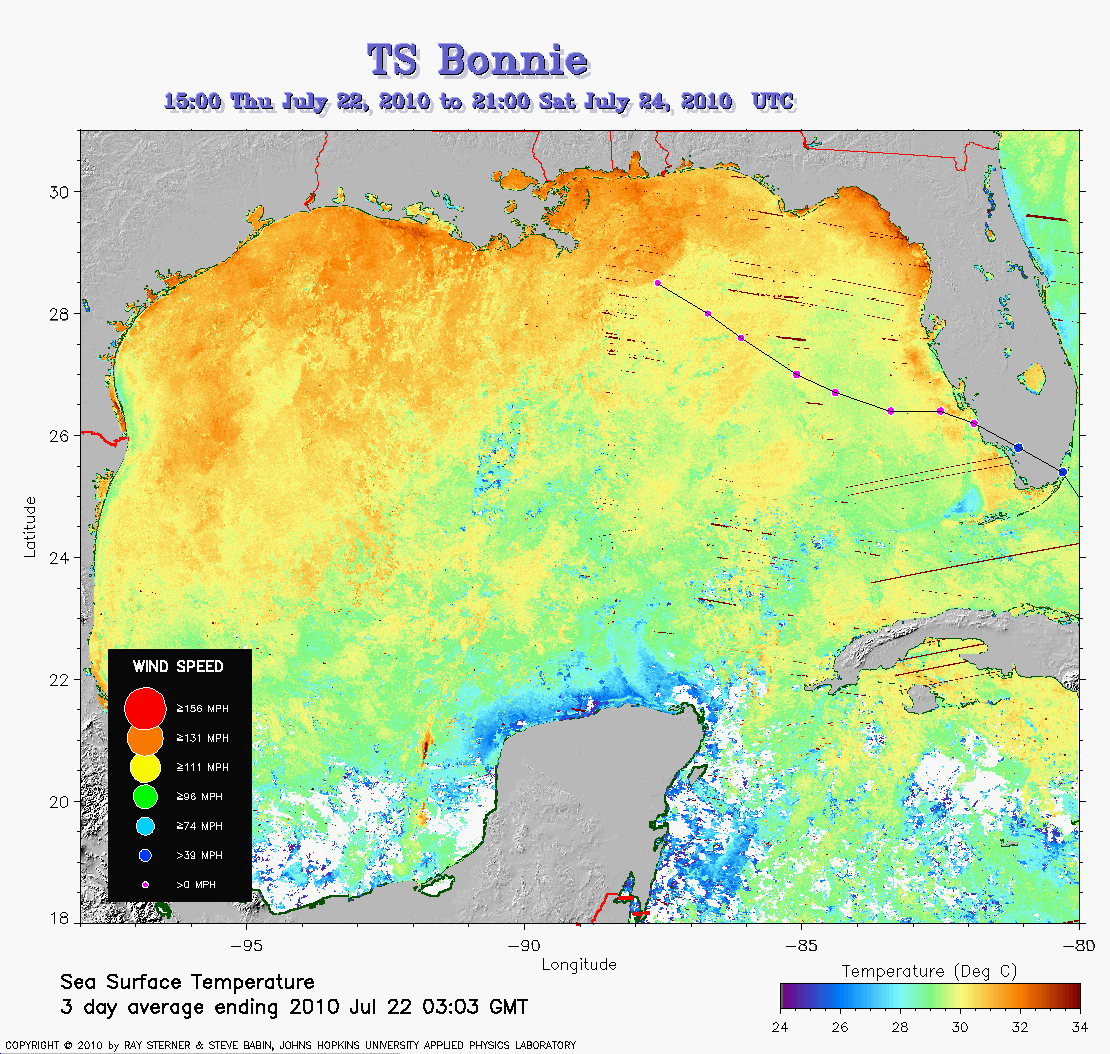 Bonnie track on Gulf of Mexico SST image of 22 July (266 Kb) This image
represents the average composite sea surface temperature (SST) derived from
NOAA satellite AVHRR data over the 3 days ending 22 July 2010. The
averaging is done to remove clouds. The streaking artifacts are due to problems with the NOAA-17 satellite data. The temperature scale for SST is
24C to 32C. The track of Bonnie is overlaid on this image.
Bonnie track on Gulf of Mexico SST image of 22 July (266 Kb) This image
represents the average composite sea surface temperature (SST) derived from
NOAA satellite AVHRR data over the 3 days ending 22 July 2010. The
averaging is done to remove clouds. The streaking artifacts are due to problems with the NOAA-17 satellite data. The temperature scale for SST is
24C to 32C. The track of Bonnie is overlaid on this image.
Track file
Track data (lat/lon, winds, etc.) in a text file.