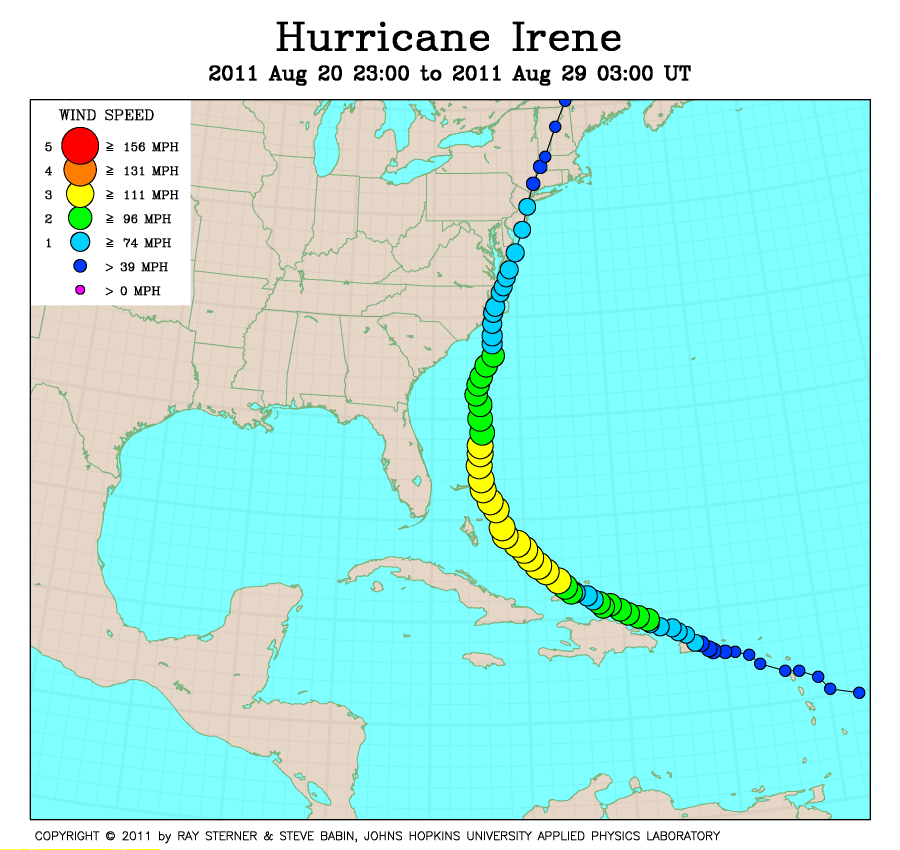
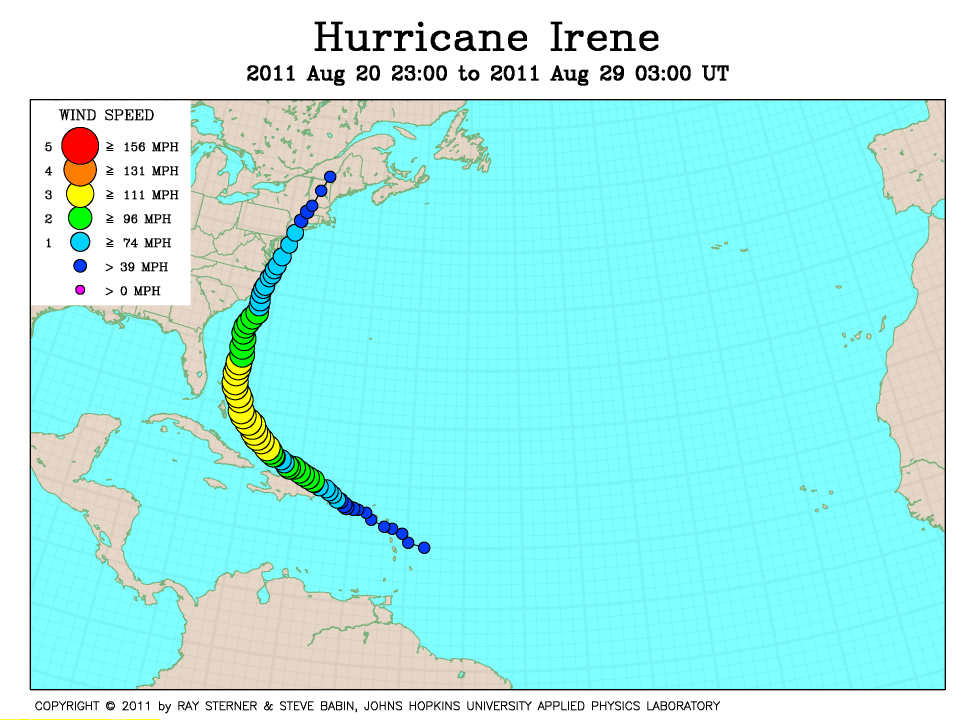
Track maps
 Irene track on SST image of 21 August (262 Kb) This image
represents the average composite sea surface temperature (SST) derived from
NOAA satellite AVHRR data over the 7 days ending 21 August 2011. The
averaging is done to remove clouds. The temperature scale for SST is
20C to 32C. The track of Irene is overlaid on this image.
Irene track on SST image of 21 August (262 Kb) This image
represents the average composite sea surface temperature (SST) derived from
NOAA satellite AVHRR data over the 7 days ending 21 August 2011. The
averaging is done to remove clouds. The temperature scale for SST is
20C to 32C. The track of Irene is overlaid on this image.
Irene formed as a tropical storm east of the Leeward Islands, but then became a hurricane after crossing Puerto Rico.
Track file
Track data (lat/lon, winds, etc.) in a text file.