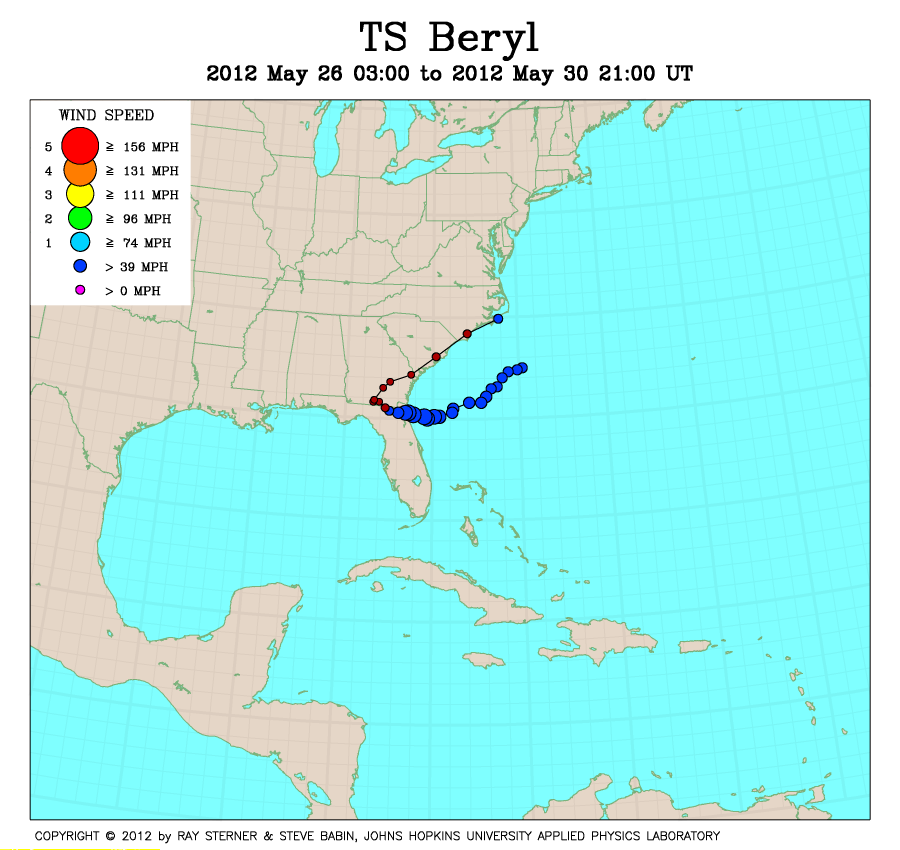
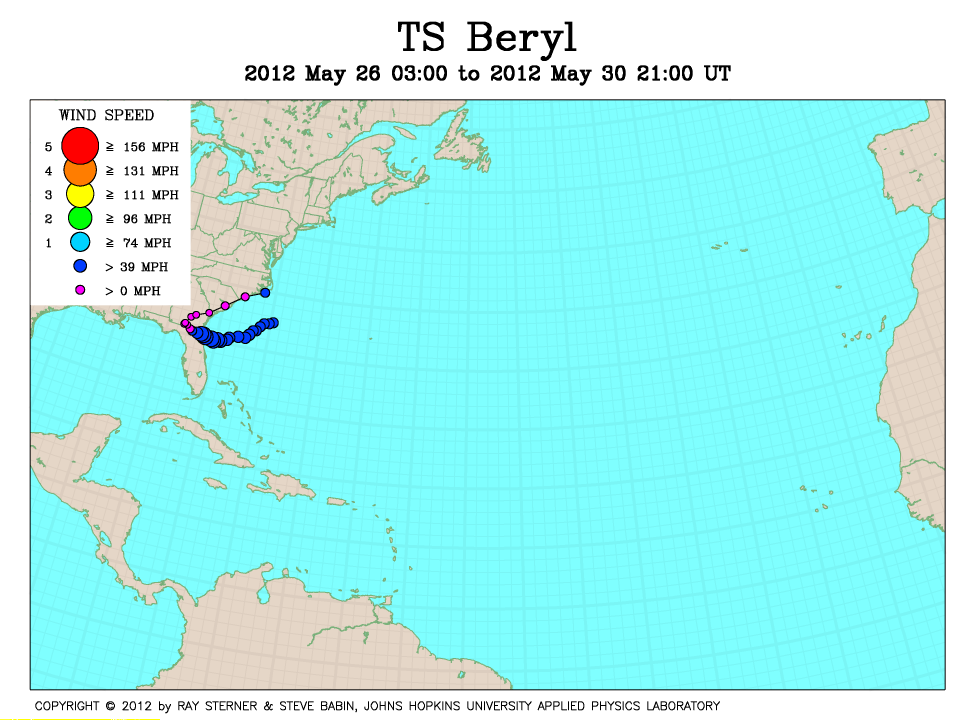
Track maps
Beryl developed off the southeast US coast as a subtropical storm, but then became a tropical storm on 27 May.
 Beryl track on SST image of 24 May (319 Kb) This image
represents the average composite sea surface temperature (SST) derived from
NOAA satellite AVHRR data over the 7 days ending 24 May 2012. The
averaging is done to remove clouds. The temperature scale for SST is
12C to 32C. The track of Beryl is overlaid on this image.
Beryl track on SST image of 24 May (319 Kb) This image
represents the average composite sea surface temperature (SST) derived from
NOAA satellite AVHRR data over the 7 days ending 24 May 2012. The
averaging is done to remove clouds. The temperature scale for SST is
12C to 32C. The track of Beryl is overlaid on this image.
Track file
Track data (lat/lon, winds, etc.) in a text file.