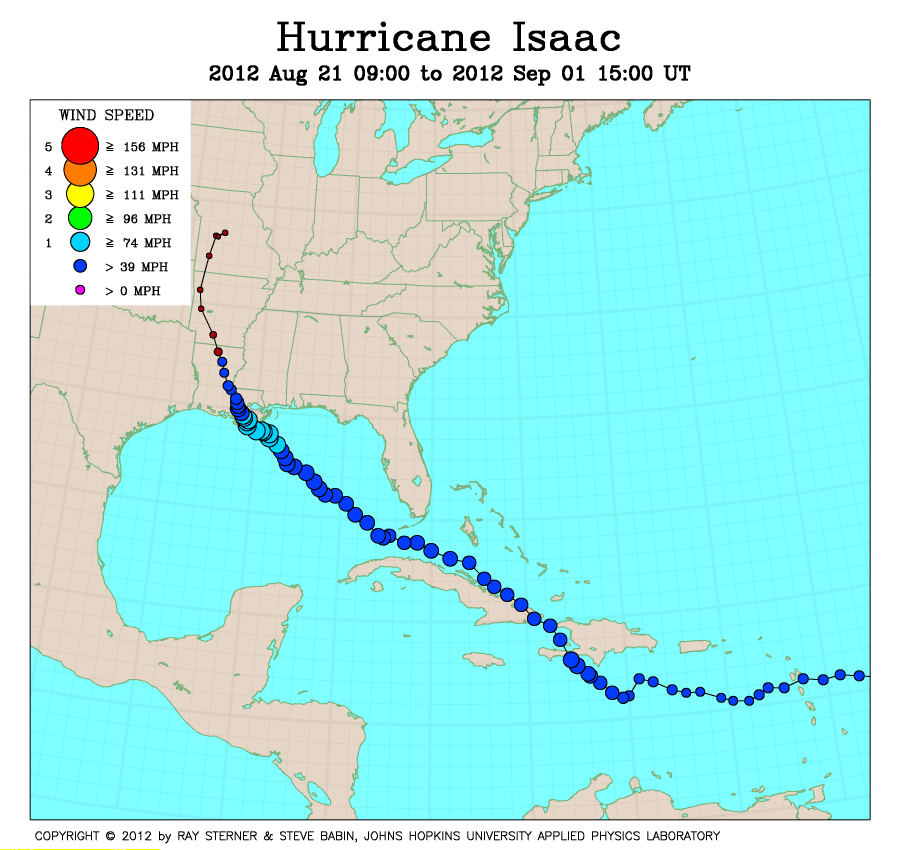
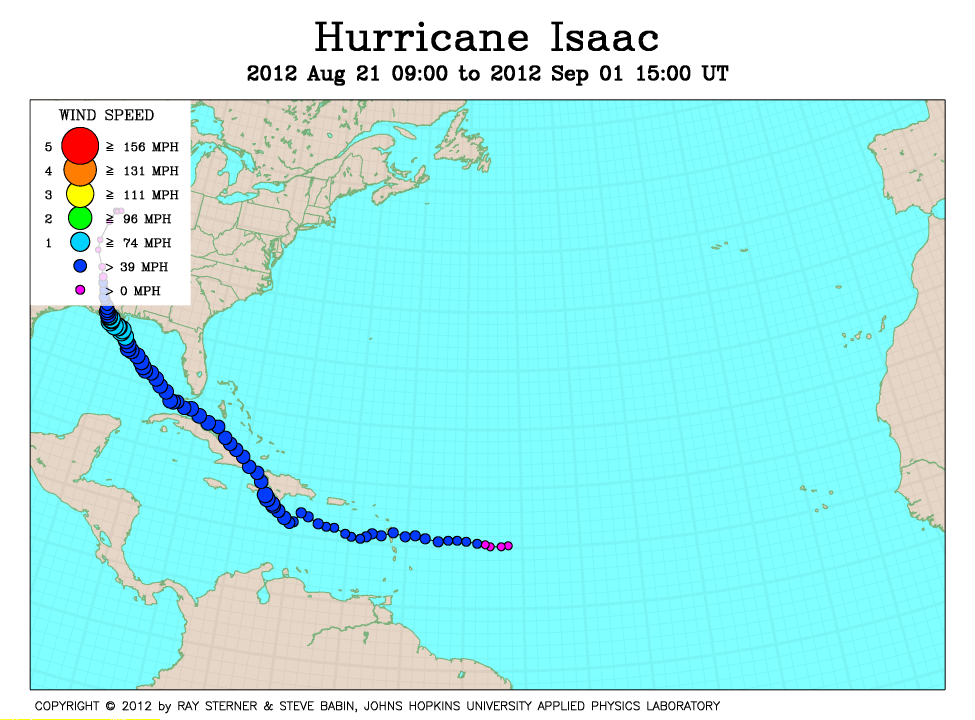
Track maps
Isaac developed from Tropical Depression Nine in the tropical Atlantic Ocean.
A very large (4039 Kb) image shows the eye of Isaac about to make landfall on the Louisiana coast.
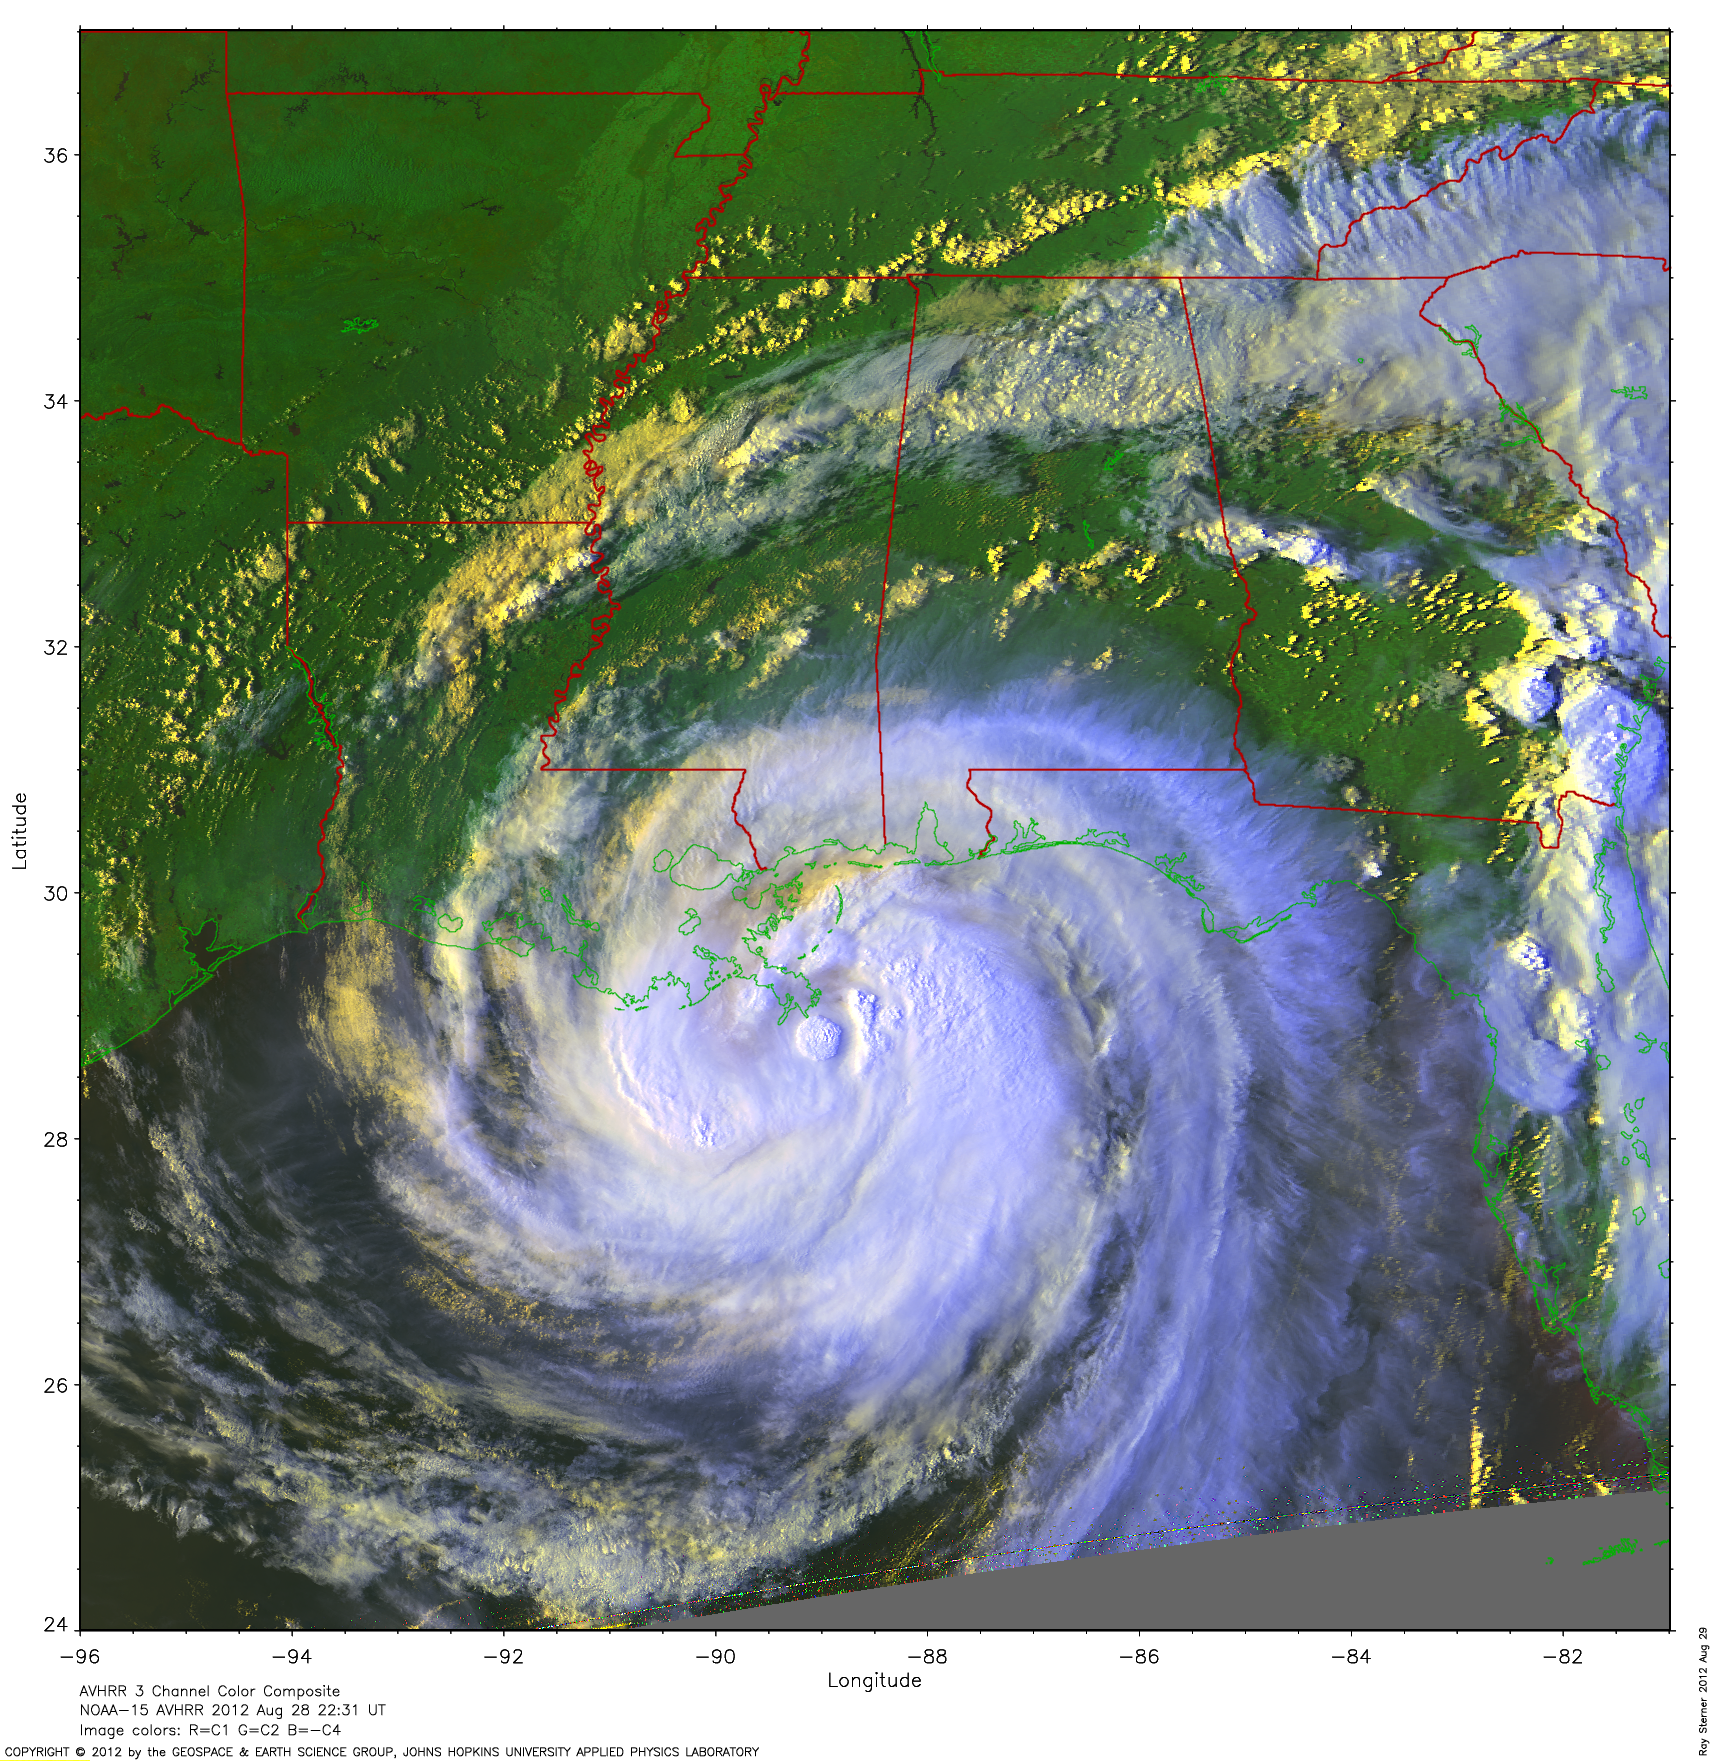
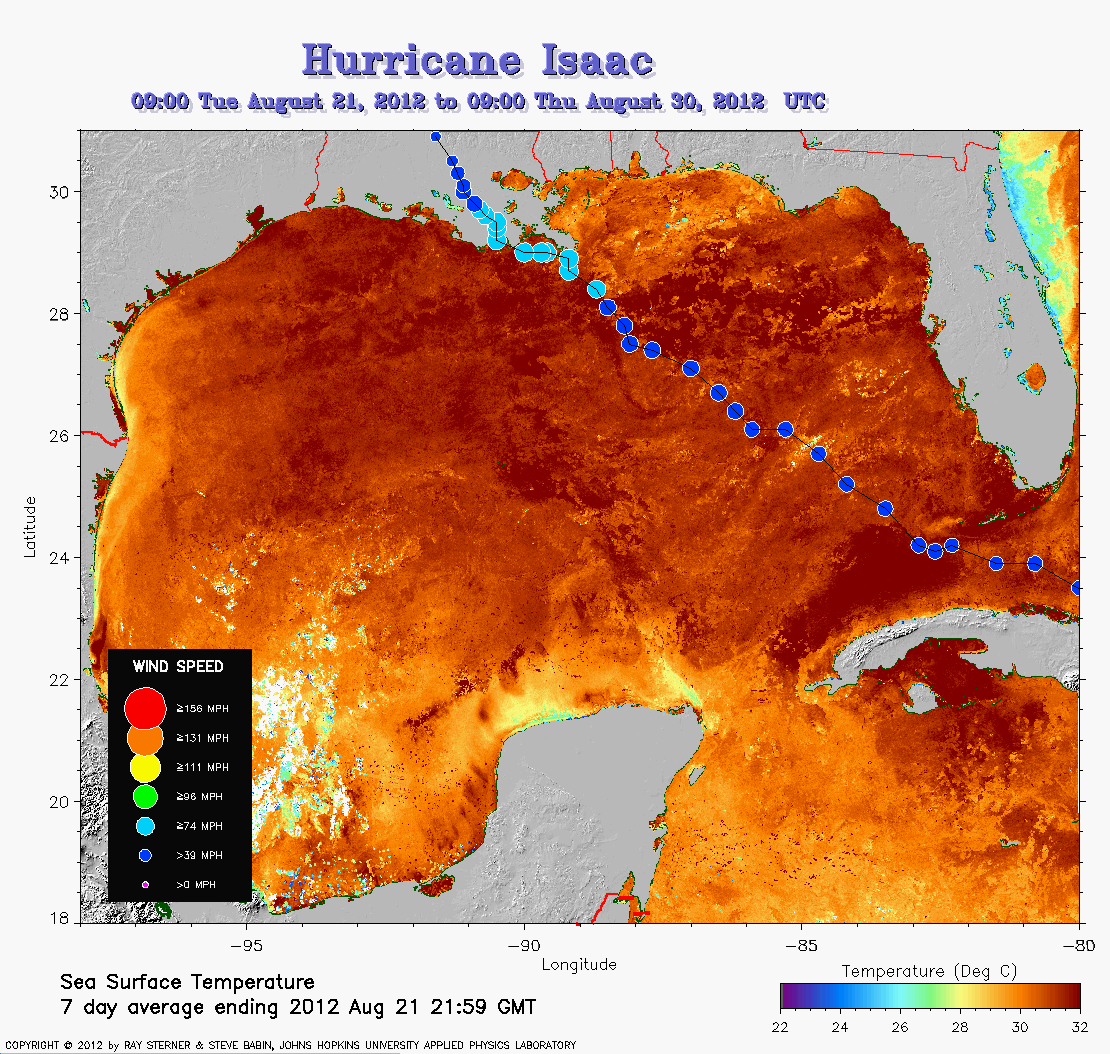 Isaac track on Gulf of Mexico SST image of 21 August (318 Kb) This image
represents the average composite sea surface temperature (SST) derived from
NOAA satellite AVHRR data over the 7 days ending 21 August 2012. The
averaging is done to remove clouds. The temperature scale for SST is
22C to 32C. The track of Isaac is overlaid on this image.
Isaac track on Gulf of Mexico SST image of 21 August (318 Kb) This image
represents the average composite sea surface temperature (SST) derived from
NOAA satellite AVHRR data over the 7 days ending 21 August 2012. The
averaging is done to remove clouds. The temperature scale for SST is
22C to 32C. The track of Isaac is overlaid on this image.
 Isaac track on Atlantic Ocean SST image of 23 August (266 Kb) This image
represents the average composite sea surface temperature (SST) derived from
NOAA satellite AVHRR data over the 7 days ending 23 August 2012. The
averaging is done to remove clouds. The temperature scale for SST is
22C to 32C. The track of Isaac is overlaid on this image.
Isaac track on Atlantic Ocean SST image of 23 August (266 Kb) This image
represents the average composite sea surface temperature (SST) derived from
NOAA satellite AVHRR data over the 7 days ending 23 August 2012. The
averaging is done to remove clouds. The temperature scale for SST is
22C to 32C. The track of Isaac is overlaid on this image.
Track file
Track data (lat/lon, winds, etc.) in a text file.