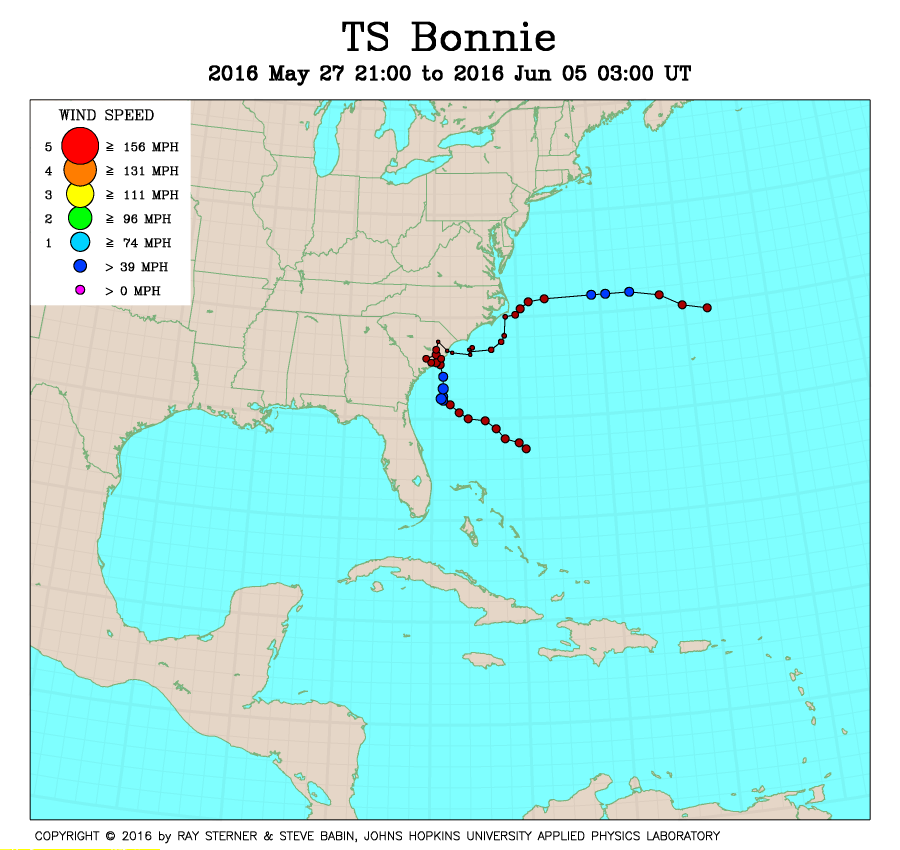
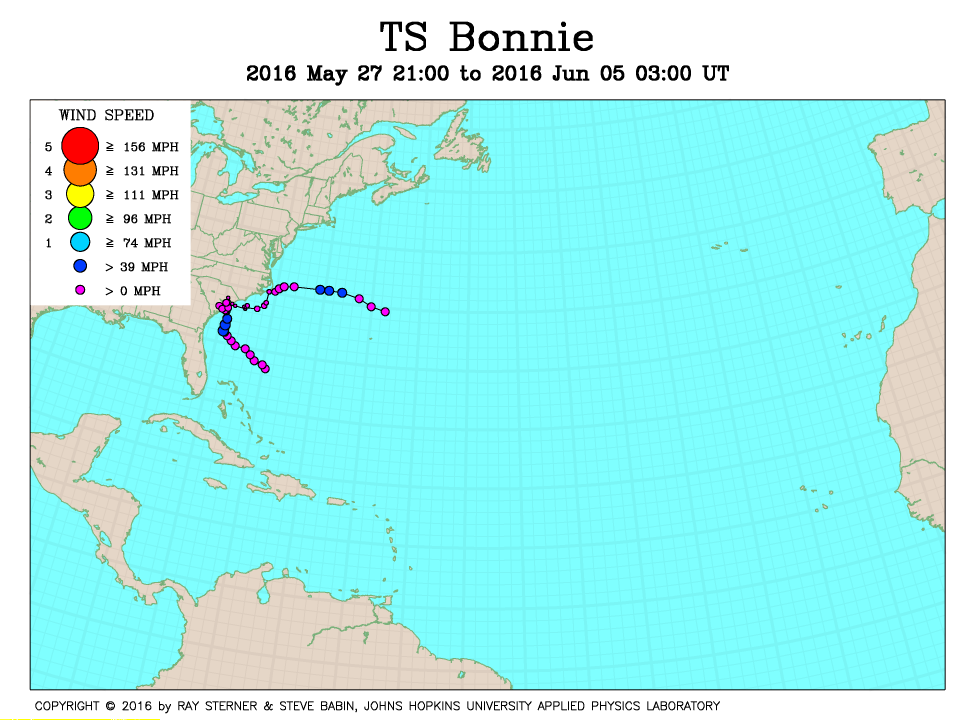
Track maps
Bonnie developed from Tropical Depression Two in the North Atlantic Ocean southeast of South Carolina.
 Bonnie track on SST image of 27 May (253 Kb) This image
represents the average composite sea surface temperature (SST) derived from
NOAA satellite AVHRR data over the 7 days ending 27 May 2016. The
averaging is done to remove clouds. The temperature scale for SST is
20C to 32C. The track of Bonnie is overlaid on this image.
Bonnie track on SST image of 27 May (253 Kb) This image
represents the average composite sea surface temperature (SST) derived from
NOAA satellite AVHRR data over the 7 days ending 27 May 2016. The
averaging is done to remove clouds. The temperature scale for SST is
20C to 32C. The track of Bonnie is overlaid on this image.
Track file
Track data (lat/lon, winds, etc.) in a text file.