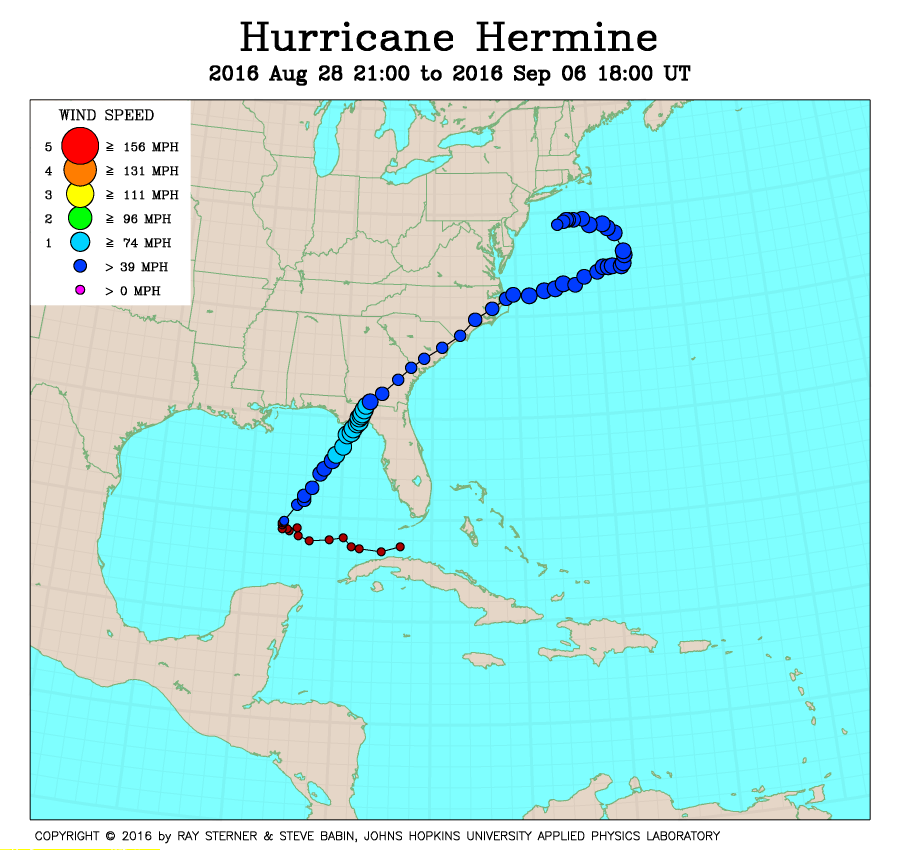
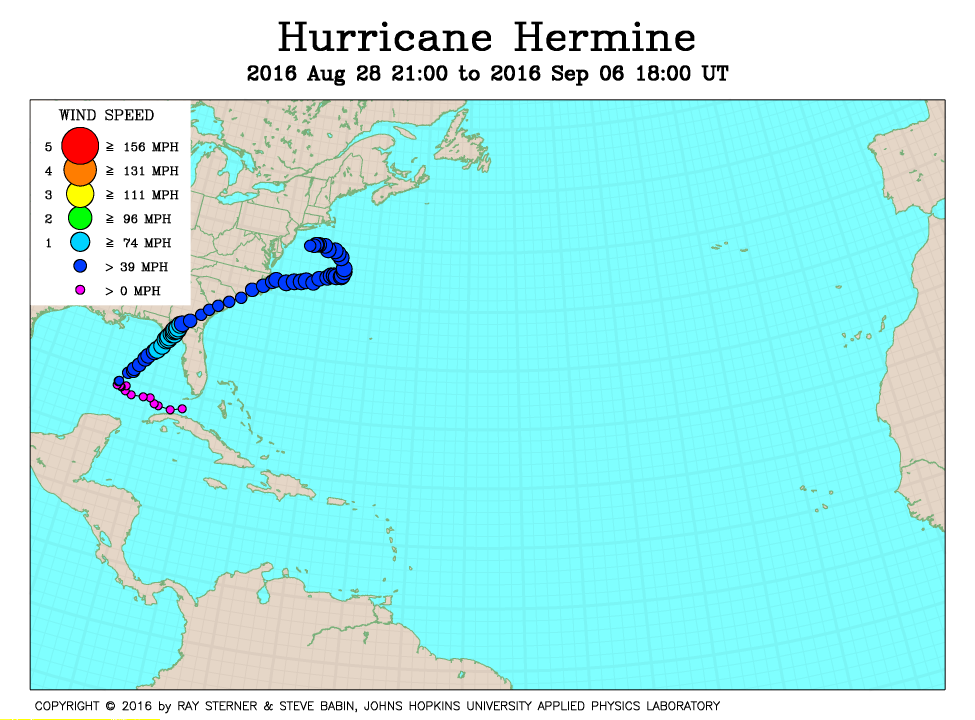
Track maps
Hermine developed from Tropical Depression Nine over the Gulf of Mexico.
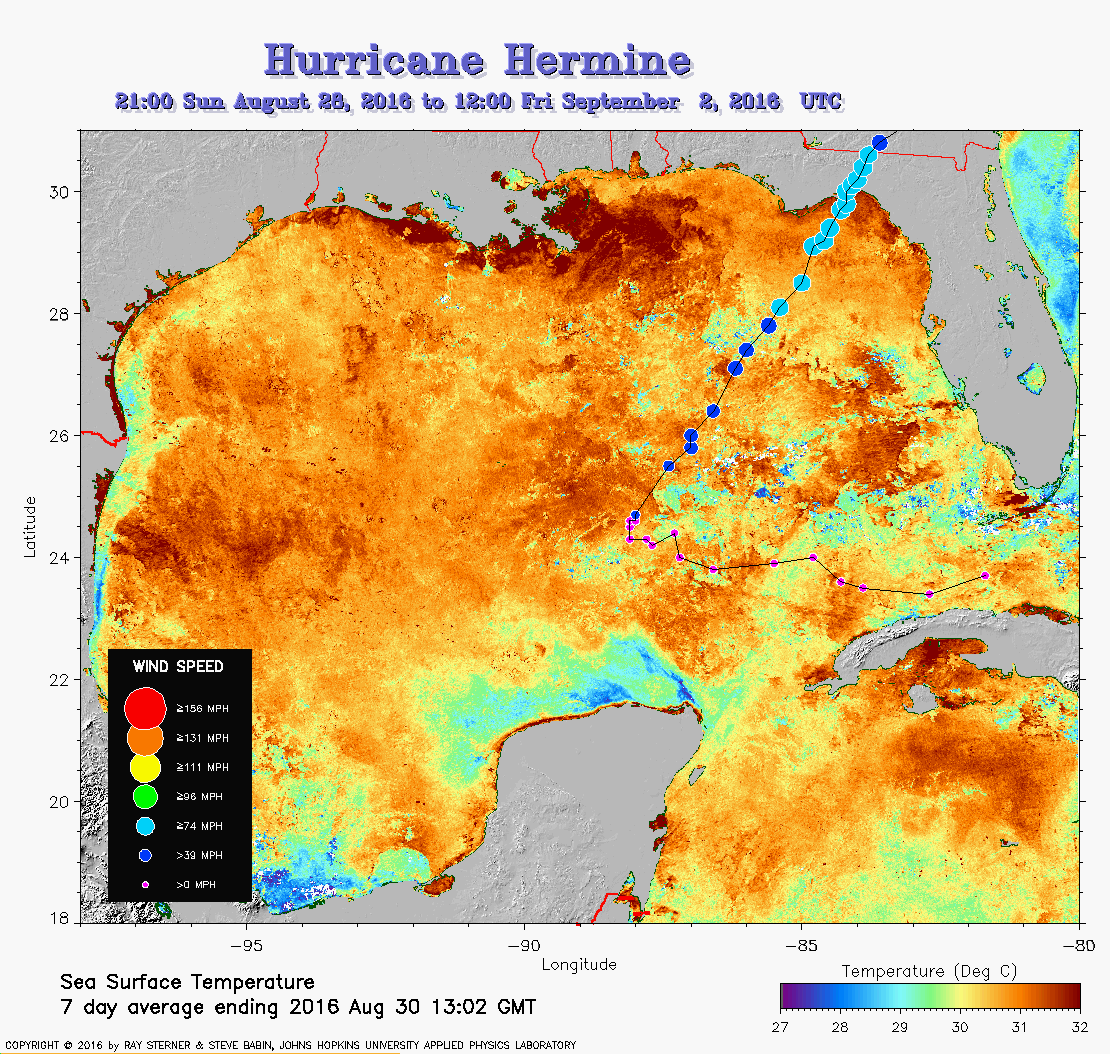 Hermine track on SST image of 30 August 2016 (310 Kb) This image
represents the average composite sea surface temperature (SST) derived from
NOAA satellite AVHRR data over the 7 days ending 30 August 2016. The
averaging is done to remove clouds. The temperature scale for SST is
27C to 32C. The track of Hermine is overlaid on this image.
Hermine track on SST image of 30 August 2016 (310 Kb) This image
represents the average composite sea surface temperature (SST) derived from
NOAA satellite AVHRR data over the 7 days ending 30 August 2016. The
averaging is done to remove clouds. The temperature scale for SST is
27C to 32C. The track of Hermine is overlaid on this image.
 Hermine track on SST image of 01 September (261 Kb) This image
represents the average composite sea surface temperature (SST) derived from
NOAA satellite AVHRR data over the 7 days ending 1 September 2016. The
averaging is done to remove clouds. The temperature scale for SST is
24C to 32C. The track of Hermine is overlaid on this image.
Hermine track on SST image of 01 September (261 Kb) This image
represents the average composite sea surface temperature (SST) derived from
NOAA satellite AVHRR data over the 7 days ending 1 September 2016. The
averaging is done to remove clouds. The temperature scale for SST is
24C to 32C. The track of Hermine is overlaid on this image.
Track file
Track data (lat/lon, winds, etc.) in a text file.