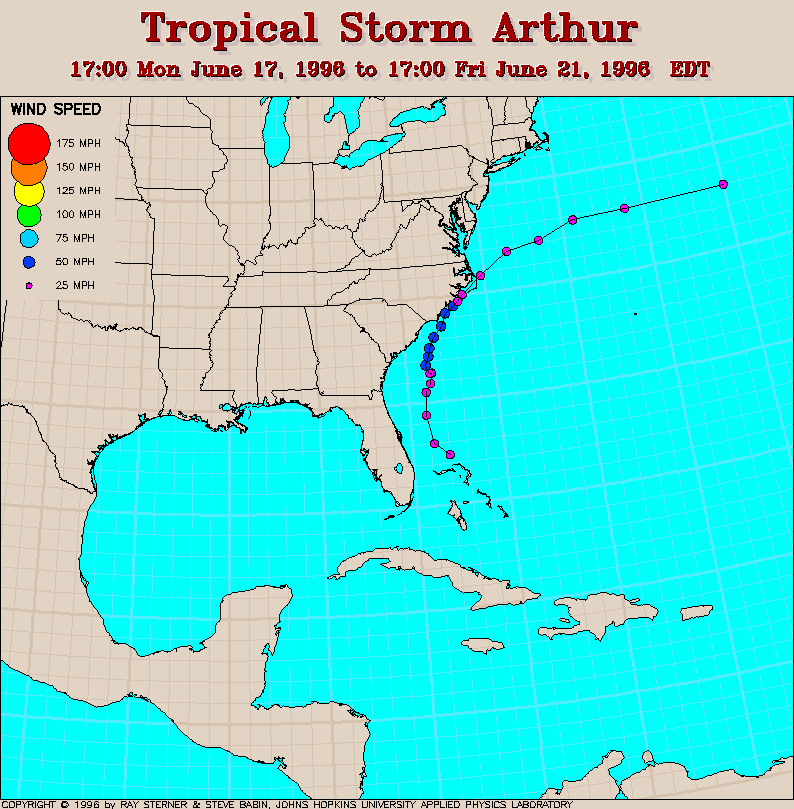
 Map
Map
Simple track plot.
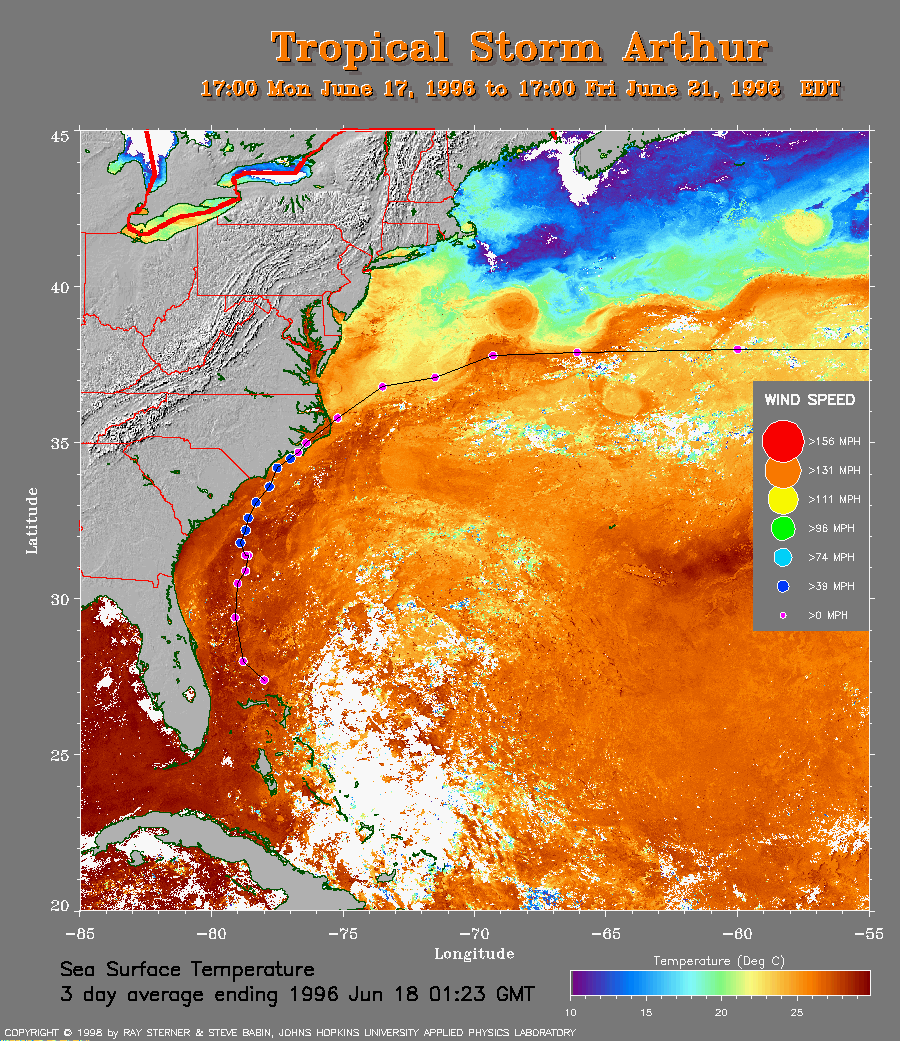 SST Map
Track plotted on average sea surface temperature.
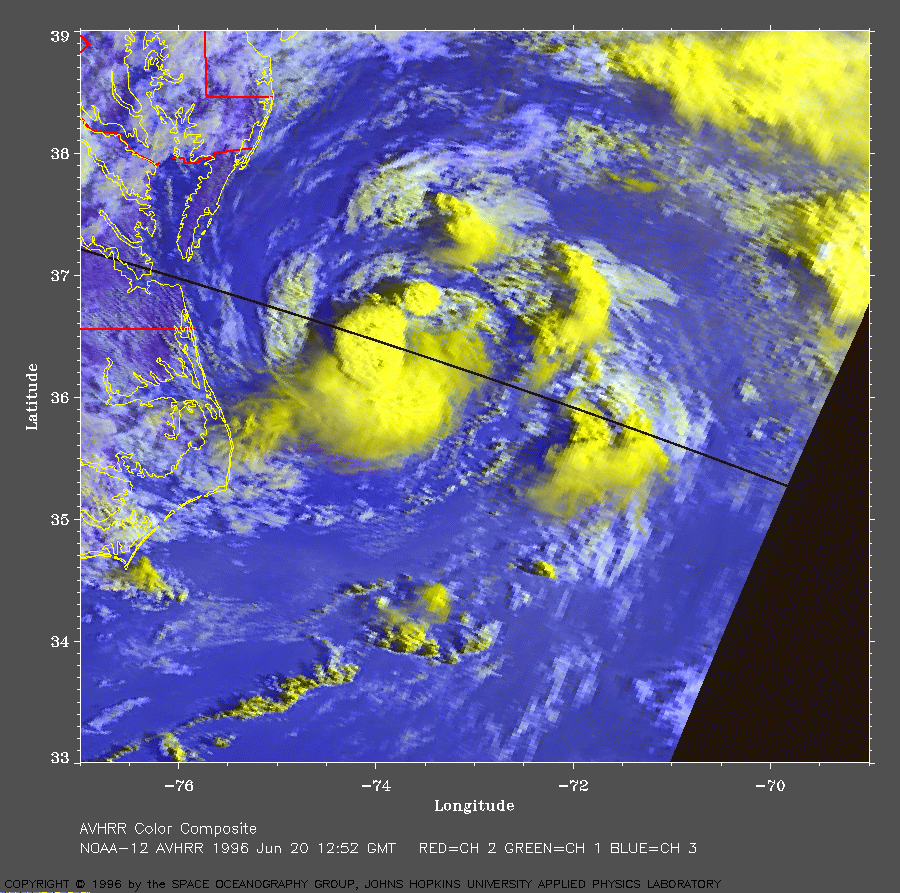 AVHRR Image at 8:52 AM EDT
1996 Jun 20
NOAA-12 AVHRR 3 channel color composite image.
This image shows the storm
in the early morning light not far northeast of Cape Hatteras.
The image extends to the edge
of the scan so has lower resolution on the east side. The black
line through the center of the storm is due to missing data.
Warmer temperatures appear blue and cooler appear yellow in this
image.
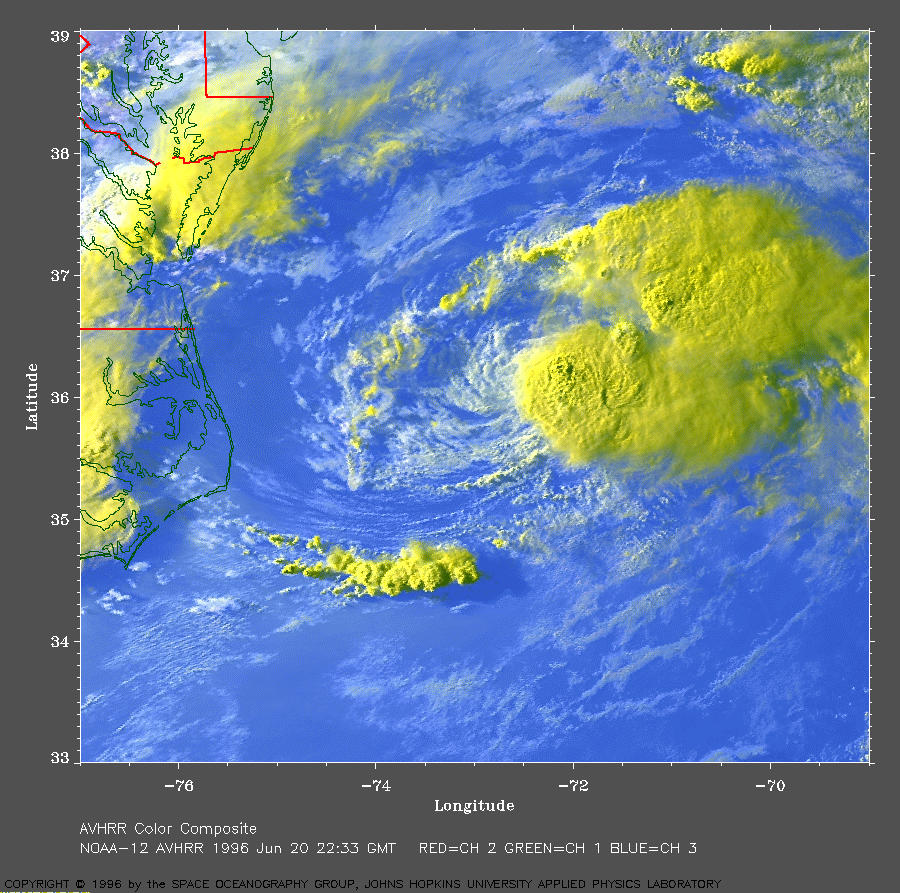 AVHRR Image at 8:33 PM EDT
1996 Jun 20
NOAA-12 AVHRR 3 channel color composite image.
This image shows the storm further from Cape Hatteras in early
evening sunlight. This image is not as close to the edge of the
scan as the one above so shows finer detail in the storm clouds.
Track file
Track data in a text file.