Sea Level Rise in Maryland
Due to events associated with climate change, most regions of the globe that were historically subject to flooding and adjacent areas that previously did not experience flooding are now more likely to flood (MCCC 2010, IPCC 2014). Coastal populations have always been at risk, but sea level rise and other metrological phenomena resulting from climate change as well as an increase in the density of human populations in coastal areas means many are at greater risk (IPCC 2014, IPCC Annex II 2014, IPCC 2013) The IPCC states with very high confidence that in urban areas climate change is projected to increase risks for people, assets, economies and ecosystems, including risks from sea level rise (IPCC 2014). The 20th century experienced the highest rate of sea-level rise in the last 2,000 years (Kemp, et al. 2011).This is vital information for coastal engineers, planners, and communities.
Understanding the mechanisms and rates of change behind global and regional variability on all scales, and projecting future changes in sea level, is an interdisciplinary challenge to oceanographers. Sea level rise varies greatly across geographic regions. A variety of physical and geological processes cause water levels to increase dramatically in some regions while others see little to no change or even declines. Sea level along the U.S. eastern seaboard is a striking example—sea level is rising faster between Cape Hatteras, North Carolina, and Cape Cod, Massachusetts, than anywhere else along the East Coast (NRC 2015). Maryland is located at the center of this region.
The immediate cause of today’s global mean sea level rise is global warming, which acts through thermal expansion of ocean waters and loss of water mass from major land reservoirs such as glaciers and ice sheets (NRC 2015). Processes contributing to sea-level rise include:
- Thermal expansion of ocean volume
- Melting of glaciers, ice caps, and ice sheets
- Terrestrial water storage
- Ocean circulation
- Vertical land movement; and
- Regional gravitational anomalies (NRC 2015, MCCC 2013).
In 2015, the National Research Council, in the publication, Sea Change: 2015–2025 Decadal Survey of Ocean Sciences, selected the research questions that warranted the highest priority in better understanding and anticipating sea-level change (NRC 2015). These priorities were endorsed by the National Science Foundation (NSF 2015).

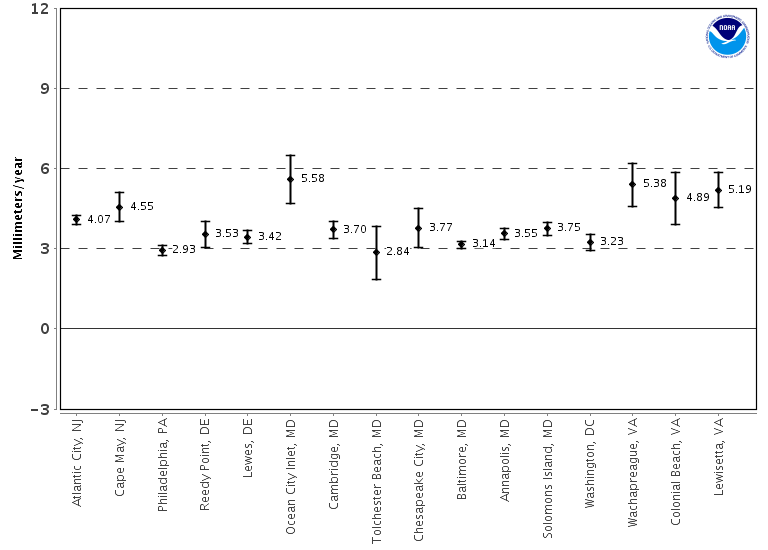
A comparison the 95% confidence intervals of the mean sea level trends obtained from NOAA's Sea Level Trends indicate that the relative sea level in the Bay is rising at around twice the average global rate of 1.8 mm per year. Trends with the narrowest confidence intervals are based on the longest data sets. Trends with the widest confidence intervals are based on only 30-40 years of data. The graphs give an indication of the differing rates of vertical land motion, given that the absolute global sea level rise is believed to be 1.7-1.8 millimeters/year [Douglas, 1991]. Tide gauges measure sea level changes relative to the land on which the the tide gauge rests. By itself, a tide gauge cannot tell the difference between local crustal motion and sea level changes, it is impossible to discern a sea level rise from land subsidence. In any given region, the apparent rate of rise can vary considerably from the long term global value. Geographical and temporal variations from the long-term mean value occur from a variety of causes such as interdecadal fluctuations of ocean density and circulation, continuing isostatic adjustment of the land level from the last deglaciation, subsidence due to the extraction of underground fluids, etc. The mean sea level (MSL) trends measured by tide gages are local relative MSL trends as opposed to the global sea level trend. Tide gauge measurements are made with respect to a local fixed reference level on land; therefore, if there is some long-term vertical land motion occurring at that location, the relative MSL trend measured there is a combination of the global sea level rate and the local vertical land motion.
To help tease out actual sea level rise from the apparent sea level rise we can use data from NOAA's National Geodetic Survey (NGS) which operates the Continuously Operating Reference Station (CORS) network consisting of Global Navigation Satellite System (GNSS) reference stations which provide phase and code range measurements in support of three dimensional positioning, meteorology, space weather, and geophysical applications throughout the United States, its territories, and a few foreign countries.
Further information can be found at Data.gov and Maryland Sea Grant.
To see how sea level rise may affect coastal regions have a look at NOAA's Sea Level Rise Viewer. You can see the vertical slider to emulate water level rise, the resulting inundation footprint, and relative depth. Click on icons in the map to view sea level rise simulations at specific locations. Areas that are hydrologically connected to the ocean are shown in shades of blue (darker blue = greater depth) and low-lying areas, displayed in green, are hydrologically "unconnected" areas that may also flood. They are determined solely by how well the elevation data captures the area’s drainage characteristics. NOAA’s Sea Level Rise Viewer makes use of realistic interactive visualization to engage the end-user. When the viewer engages in the interactive simulation of sea-level rise around their own property, it significantly increases their expressed intent to reduce their risk (Kuser Olsen, et al. 2016). Follow this link for more information regarding other sea-level rise models.
Reference list for sea level rise in Maryland.
Last revised 19 January 2018