Maryland Historical Record, 1895-2023
Generally speaking, the weather and climate we experience, largely describes conditions in the atmosphere but these conditions are consecuence of the interactions among the different elements of the Climate System. Locally, the conditions we experience are influenced regionaly by factors such as latitude, elevation, proximity to large bodies of water and mountains, and by the more fundamental forcings of the climate system such as the Sun, the Earth's position in space relative to the Sun, continental drift, volcanic eruptions and human-made factors (e.g., greenhouse gas emisions and land-surface changes). The impact of these climate forcings and interactions among the elements of the climate system induce climate variability and change at scales of years, decades, multidecades, centuries and larger. The entangling of natural and anthropogenic causes imposes a challenge for detecting and projecting anthropogenic climate change.
Monitoring the surface climate via temperatures and precipitation helps to identify climate variability and change, thus the need to have historical, long-term, records.
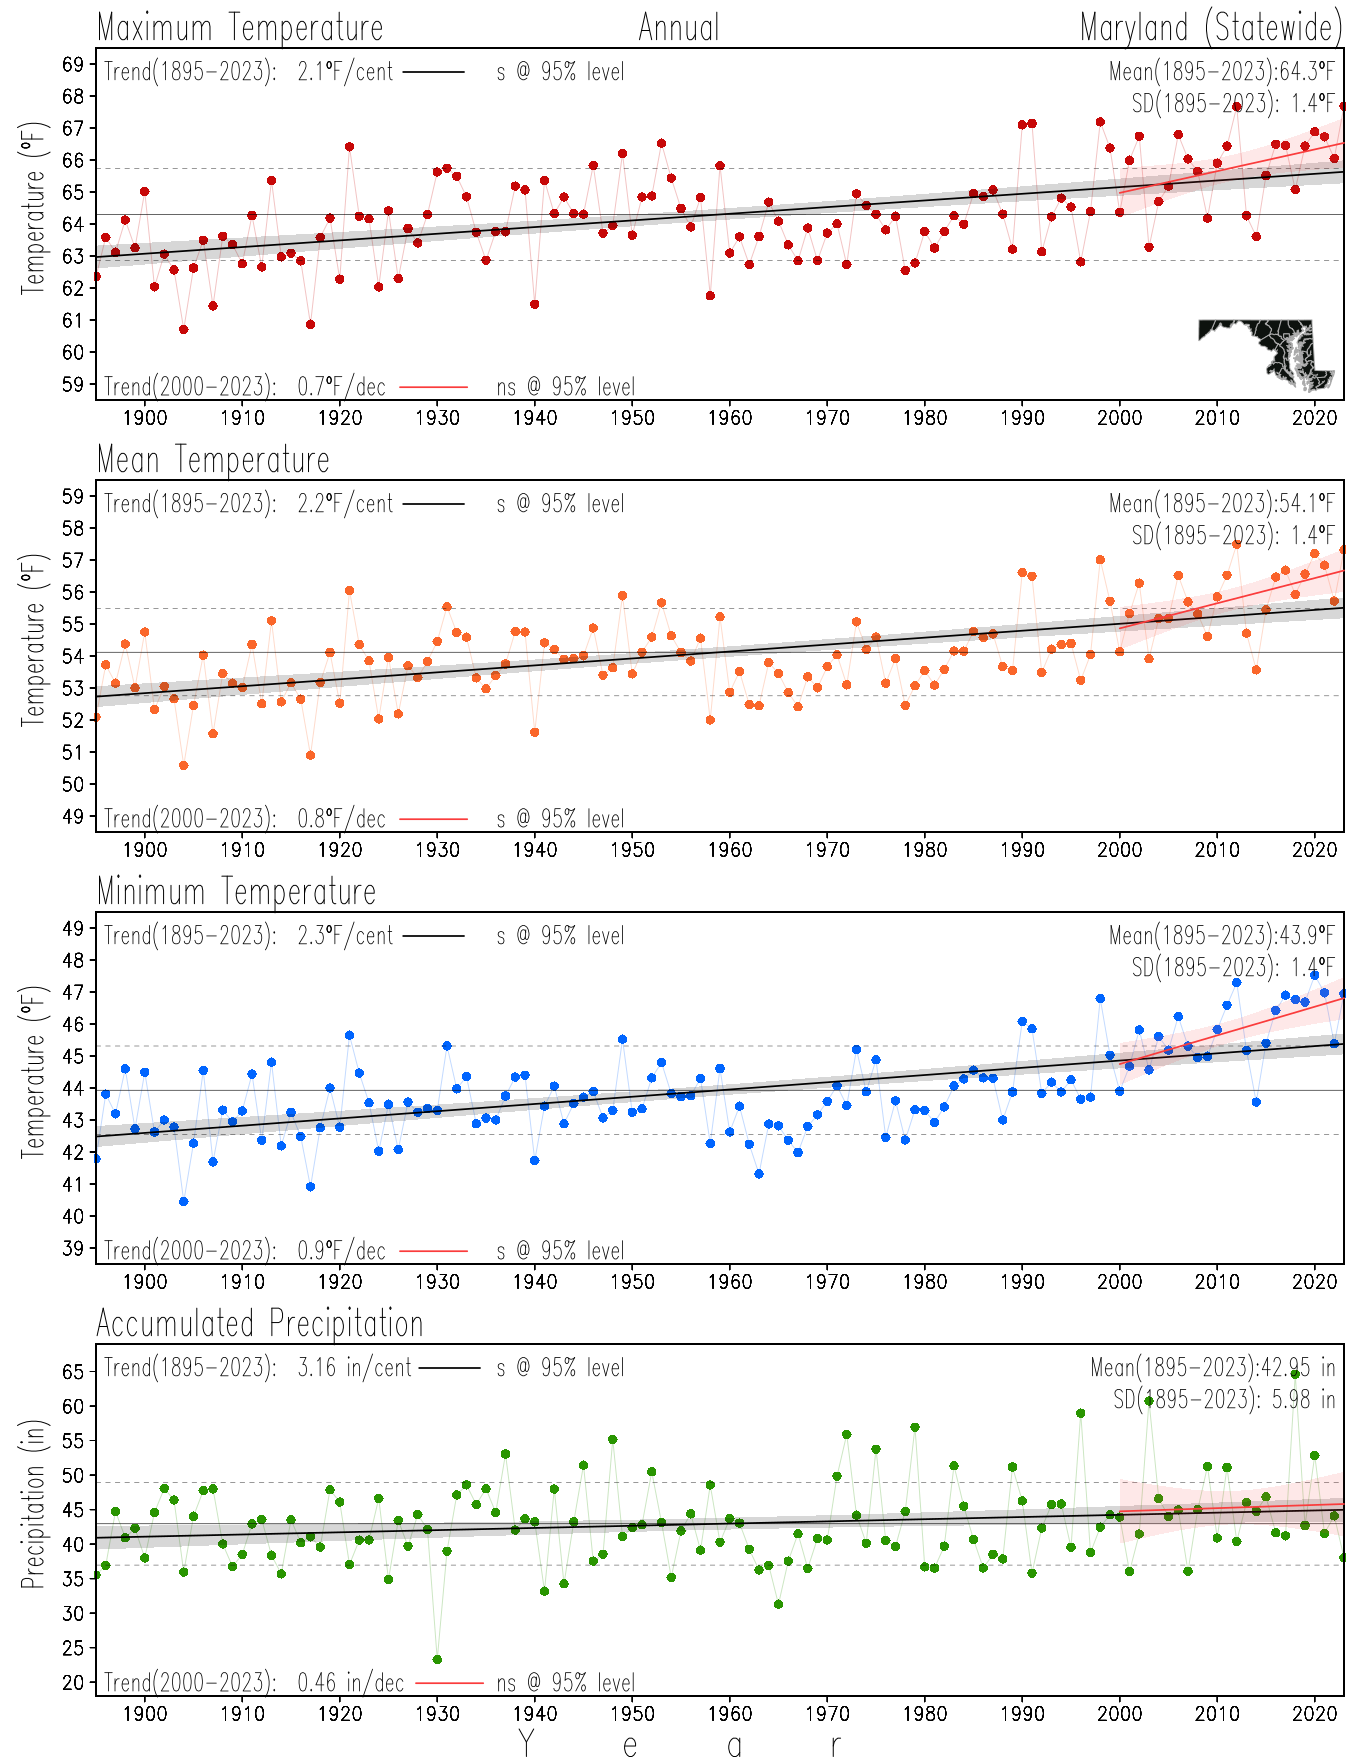
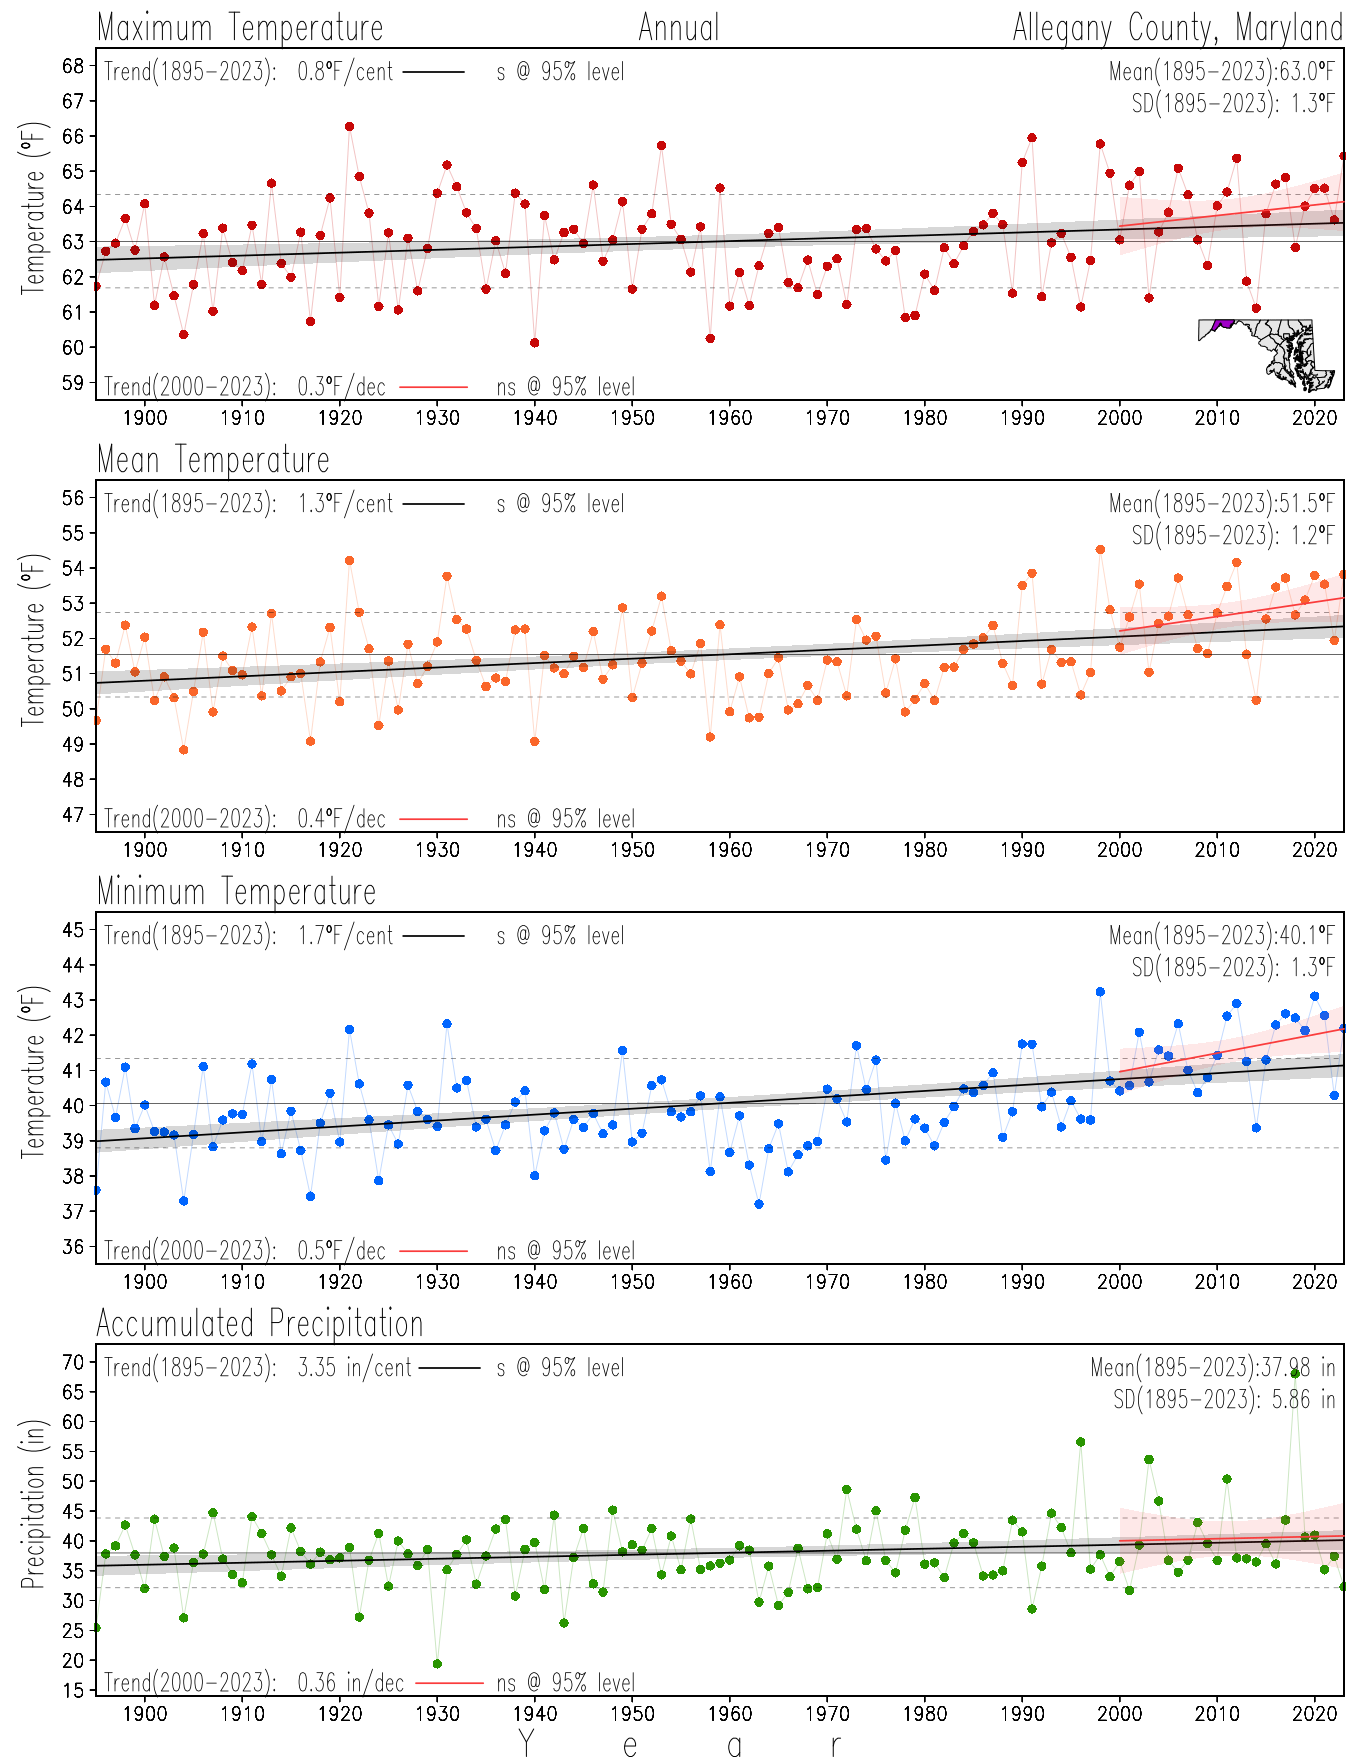
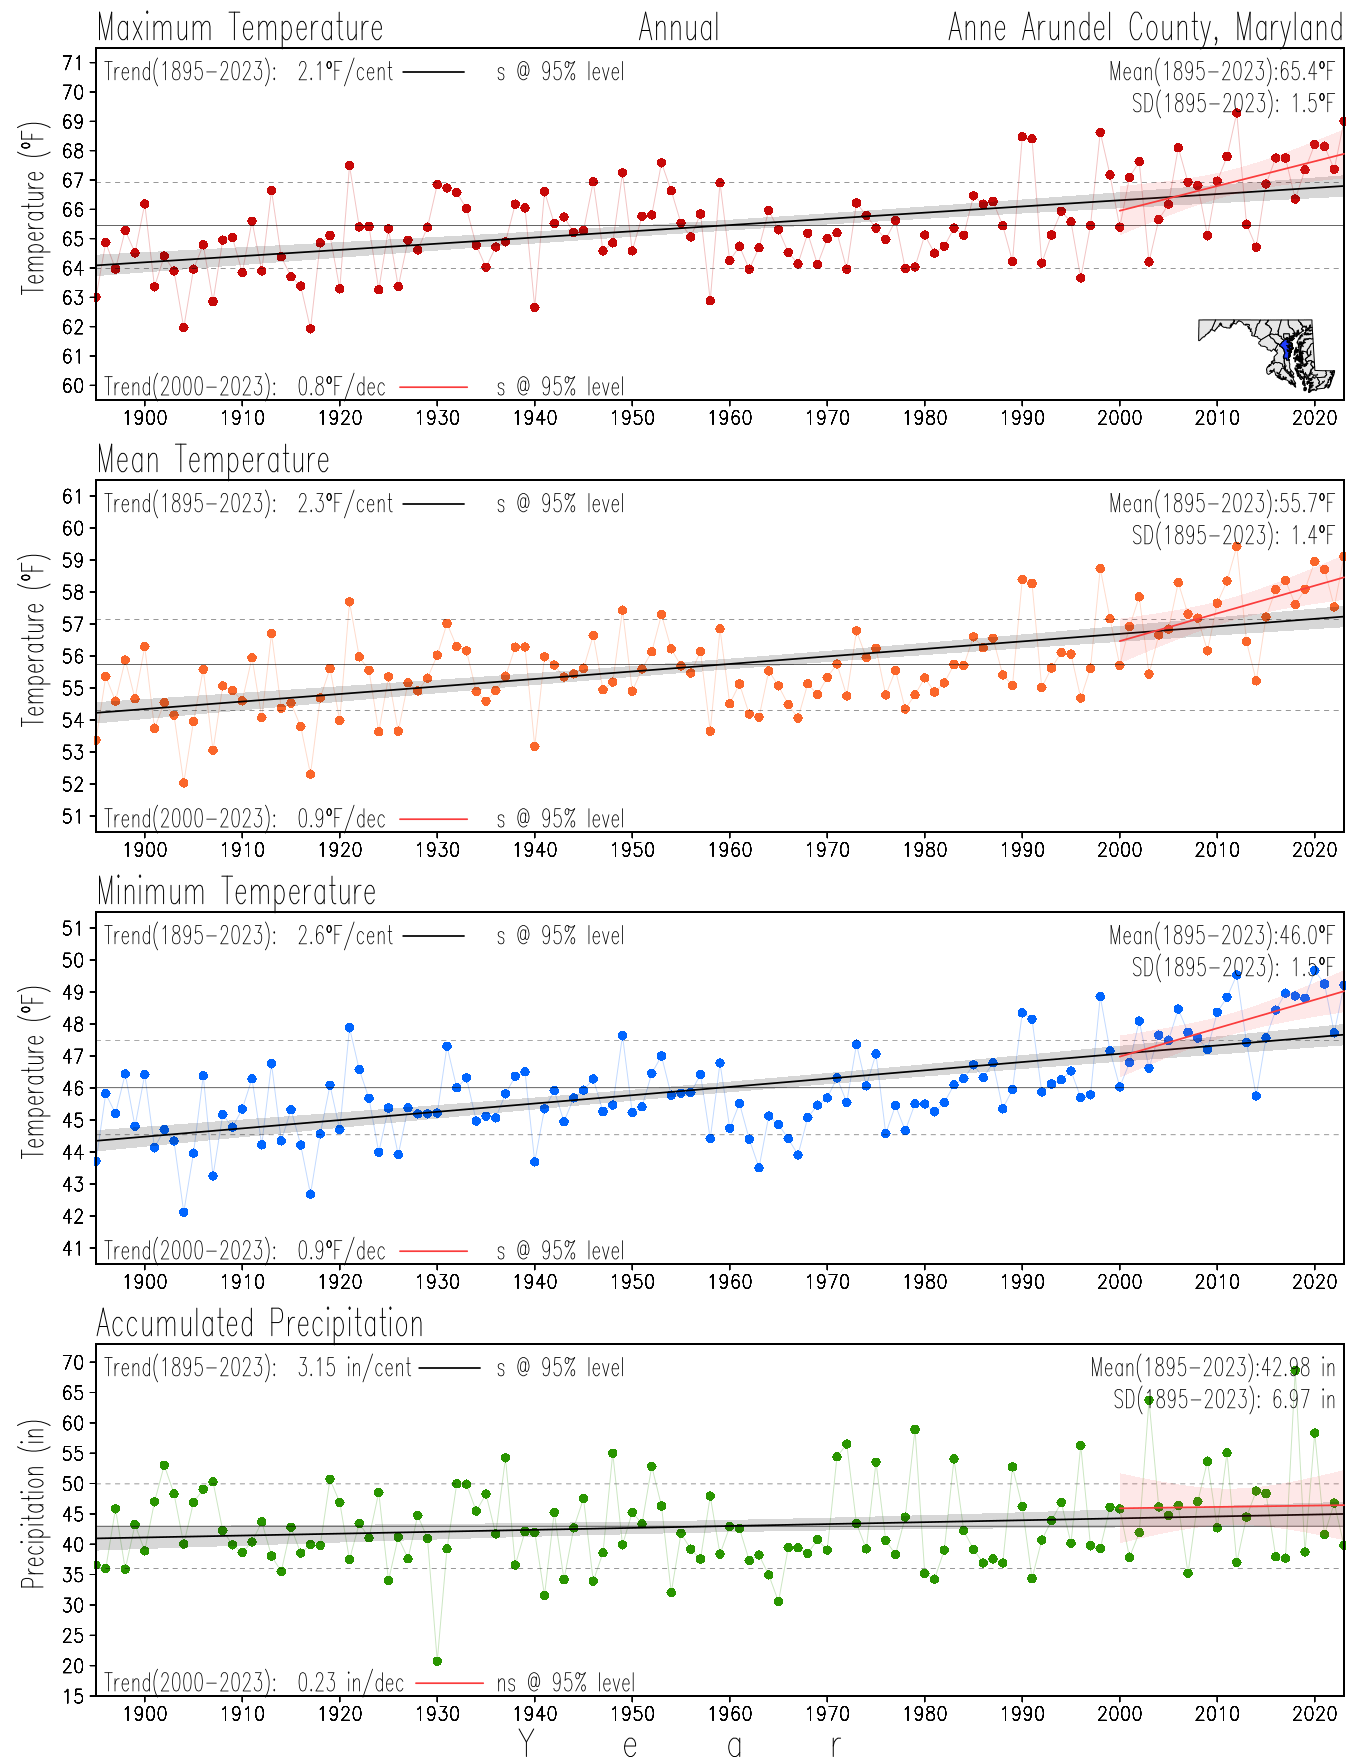
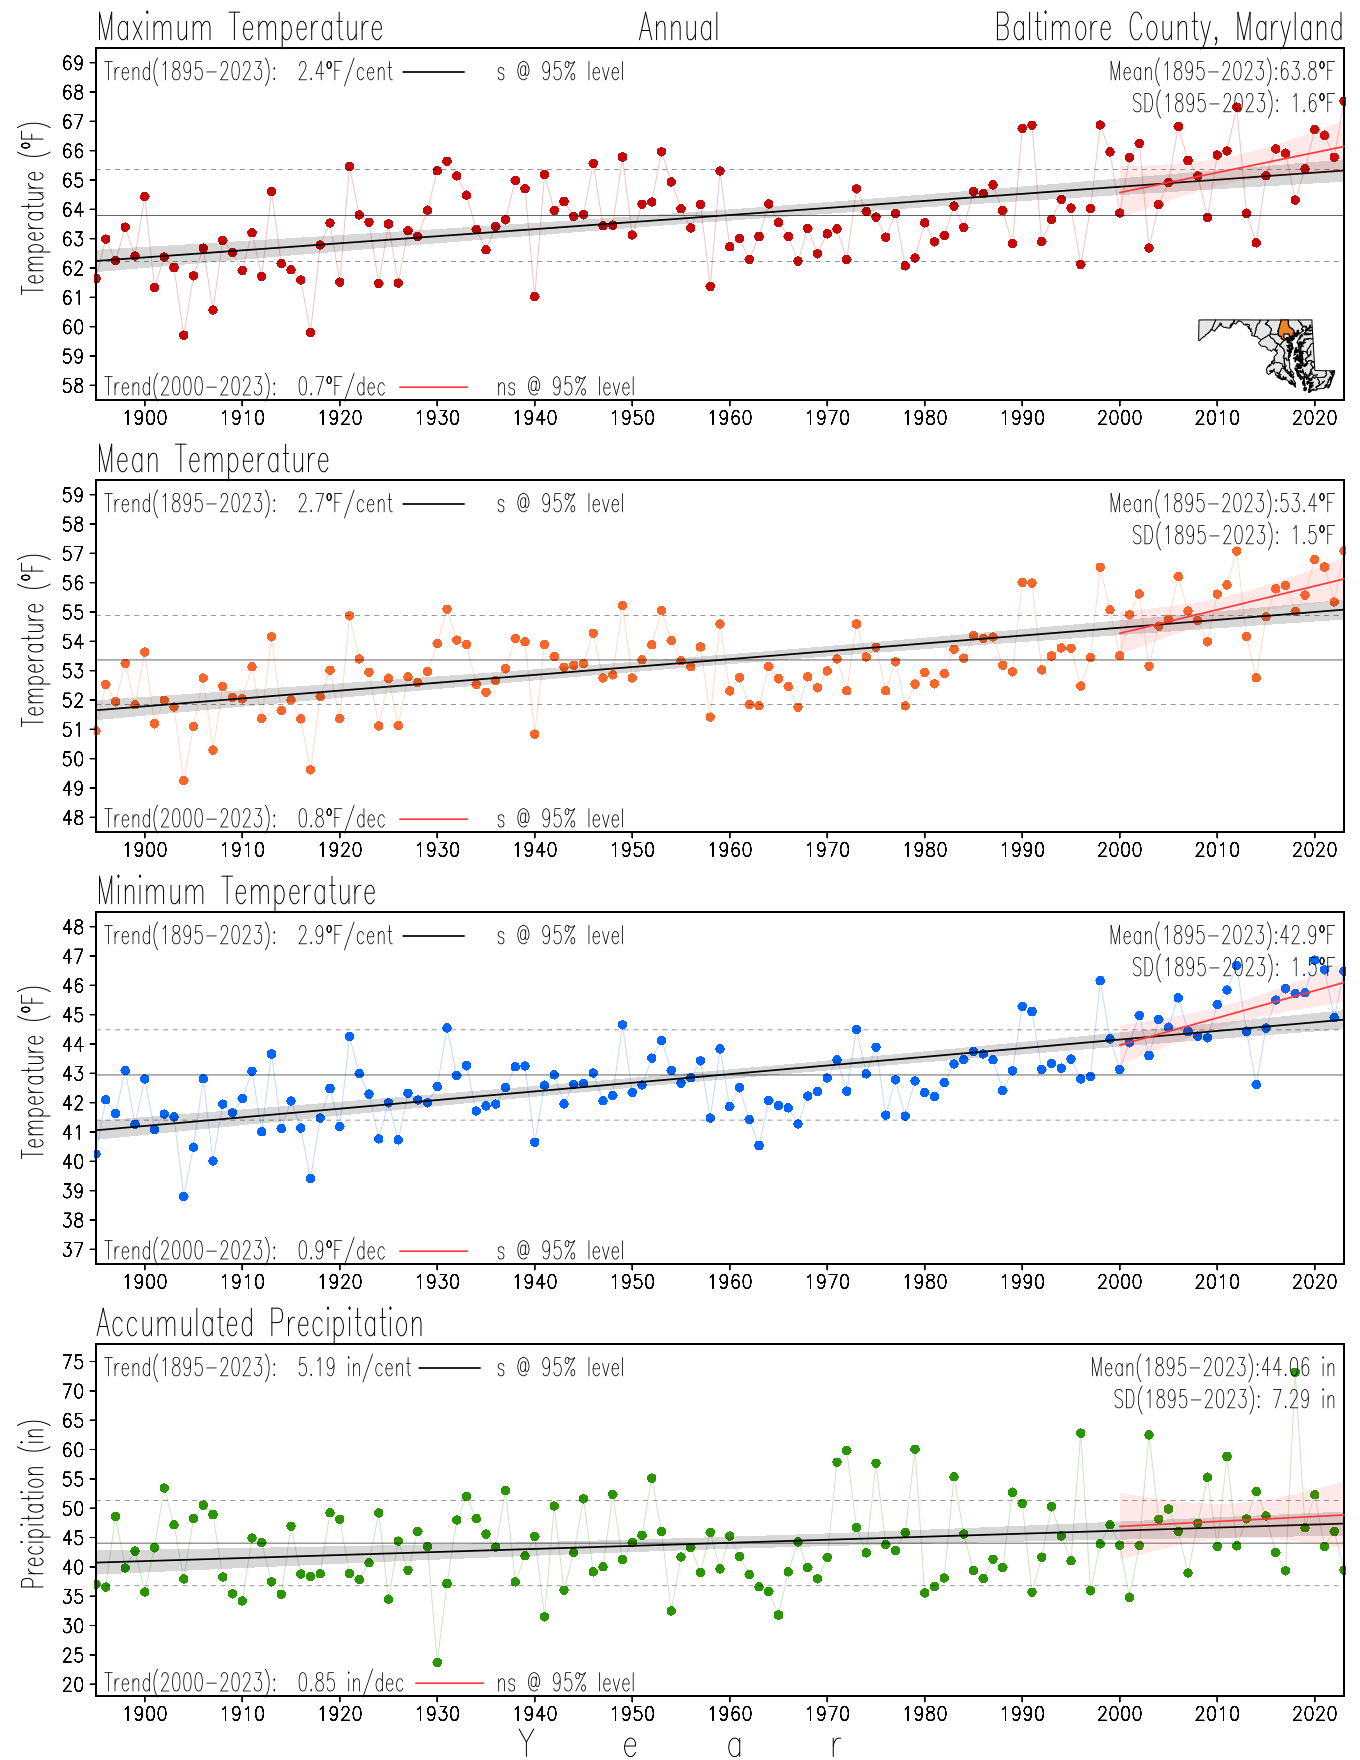
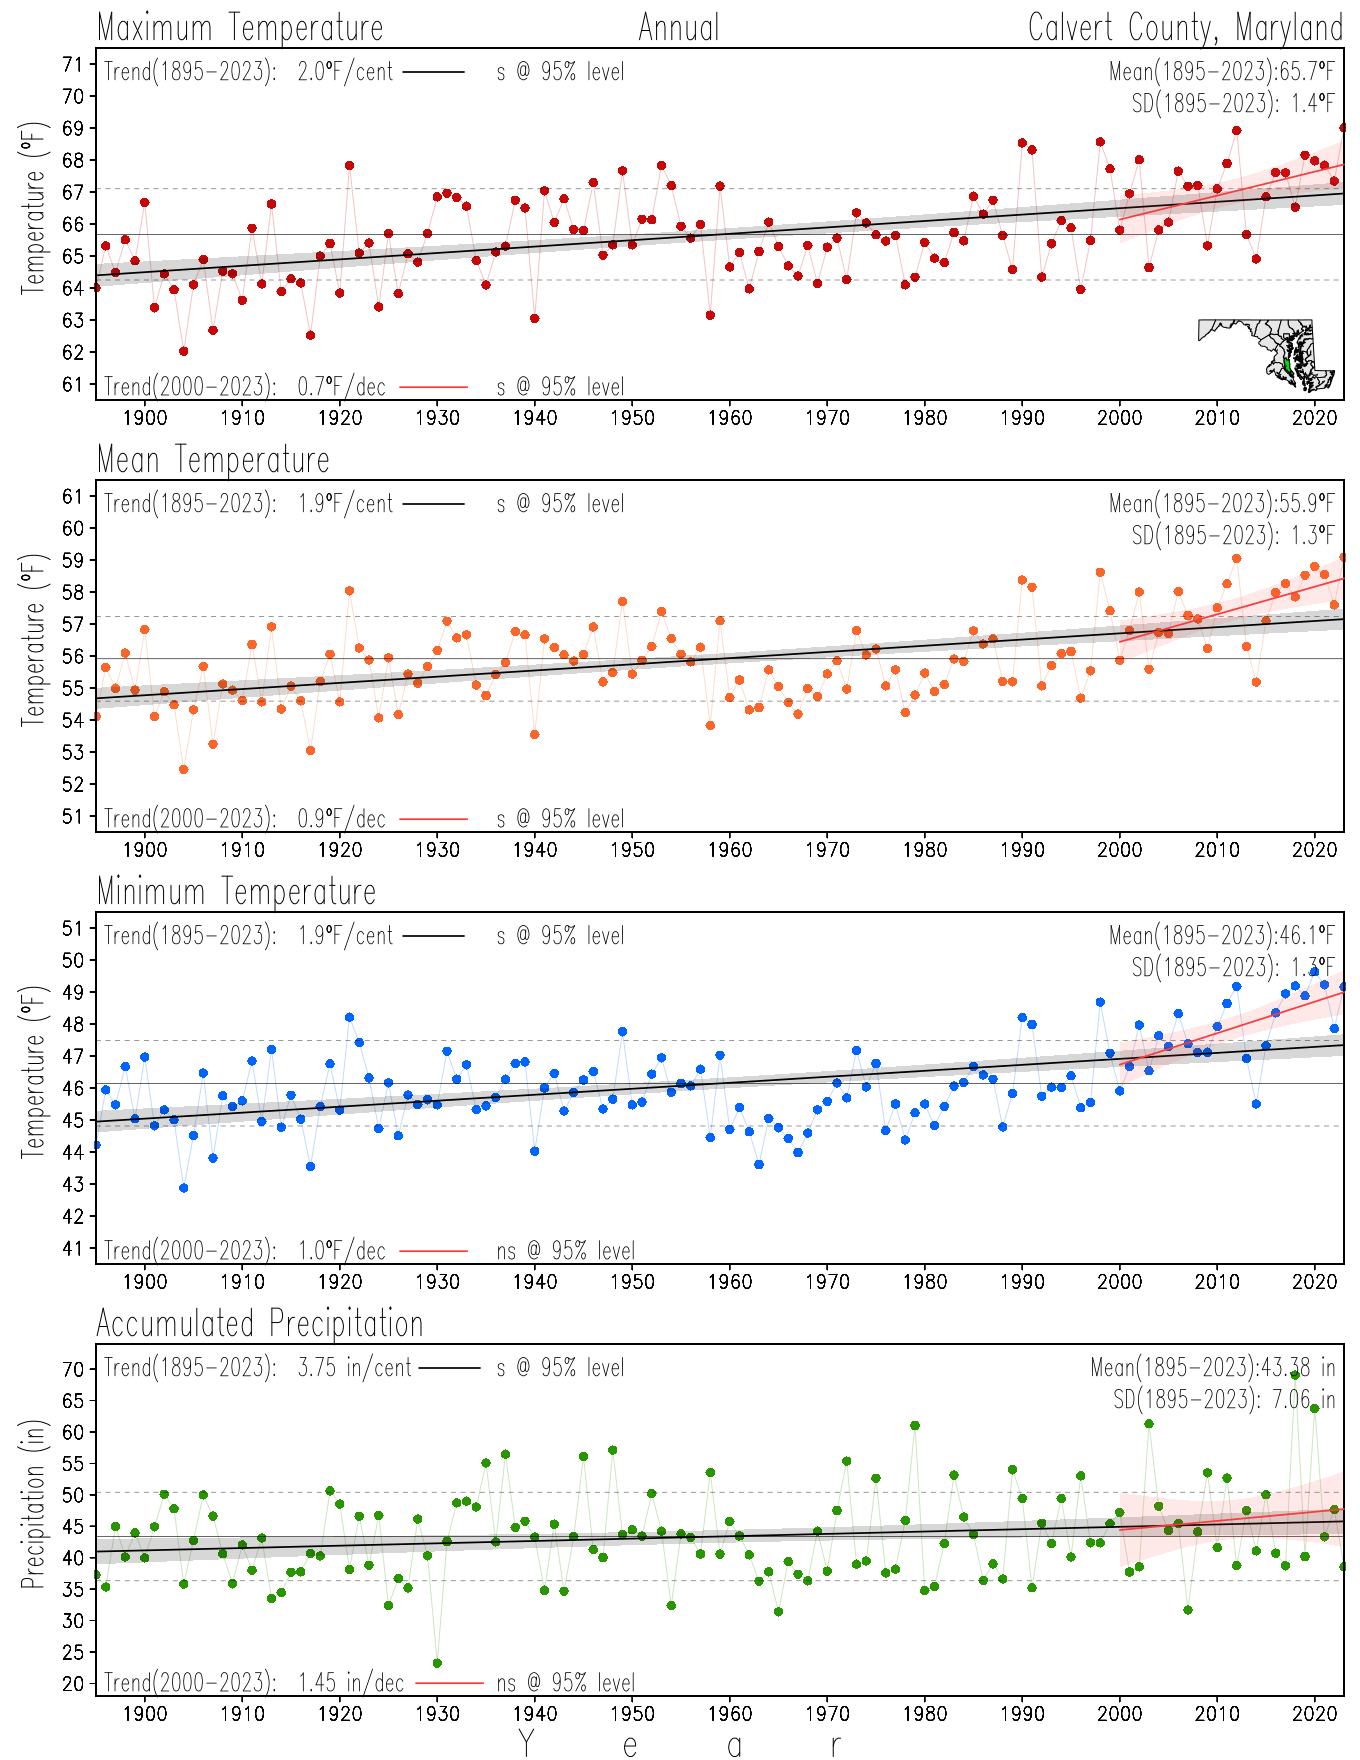
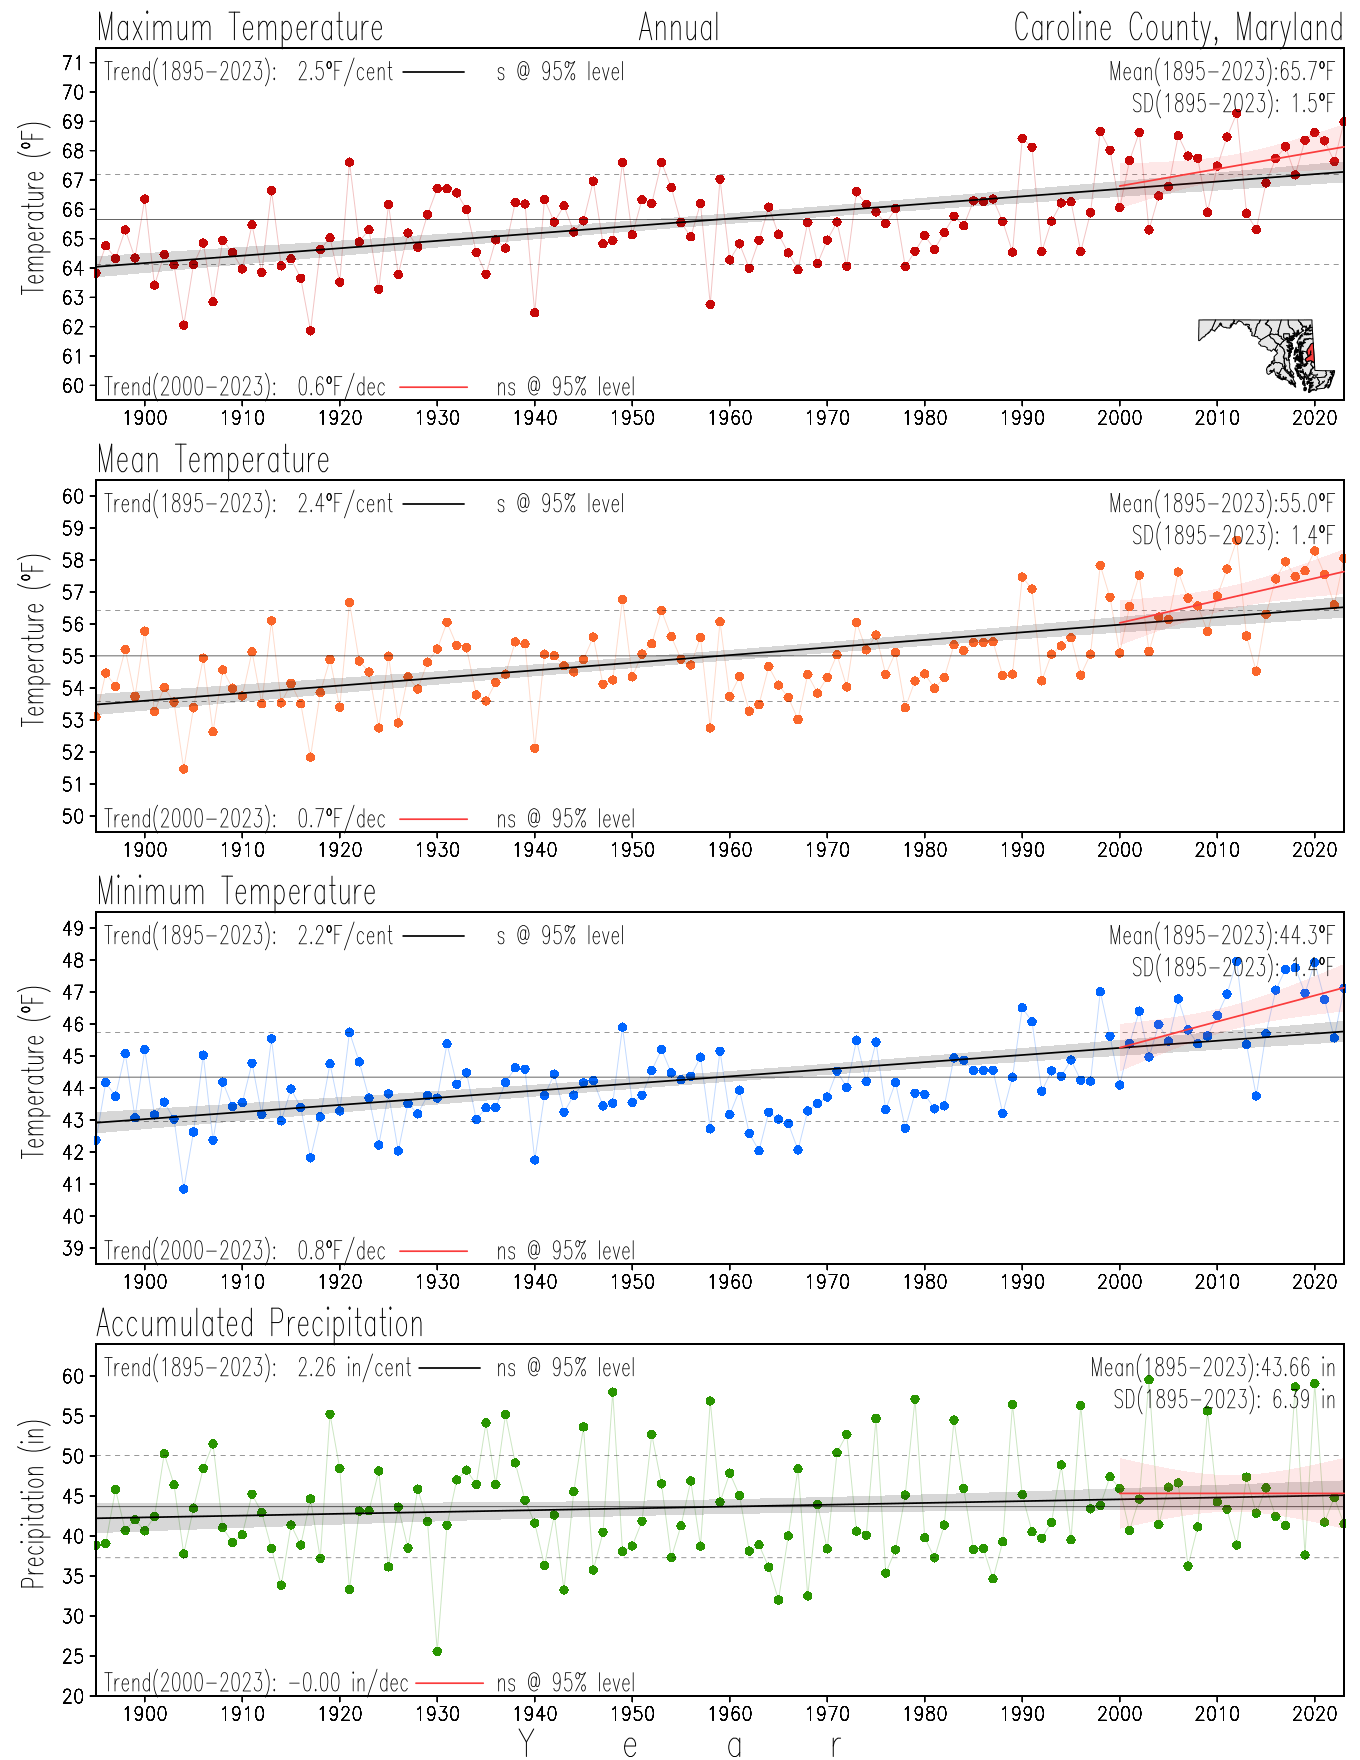
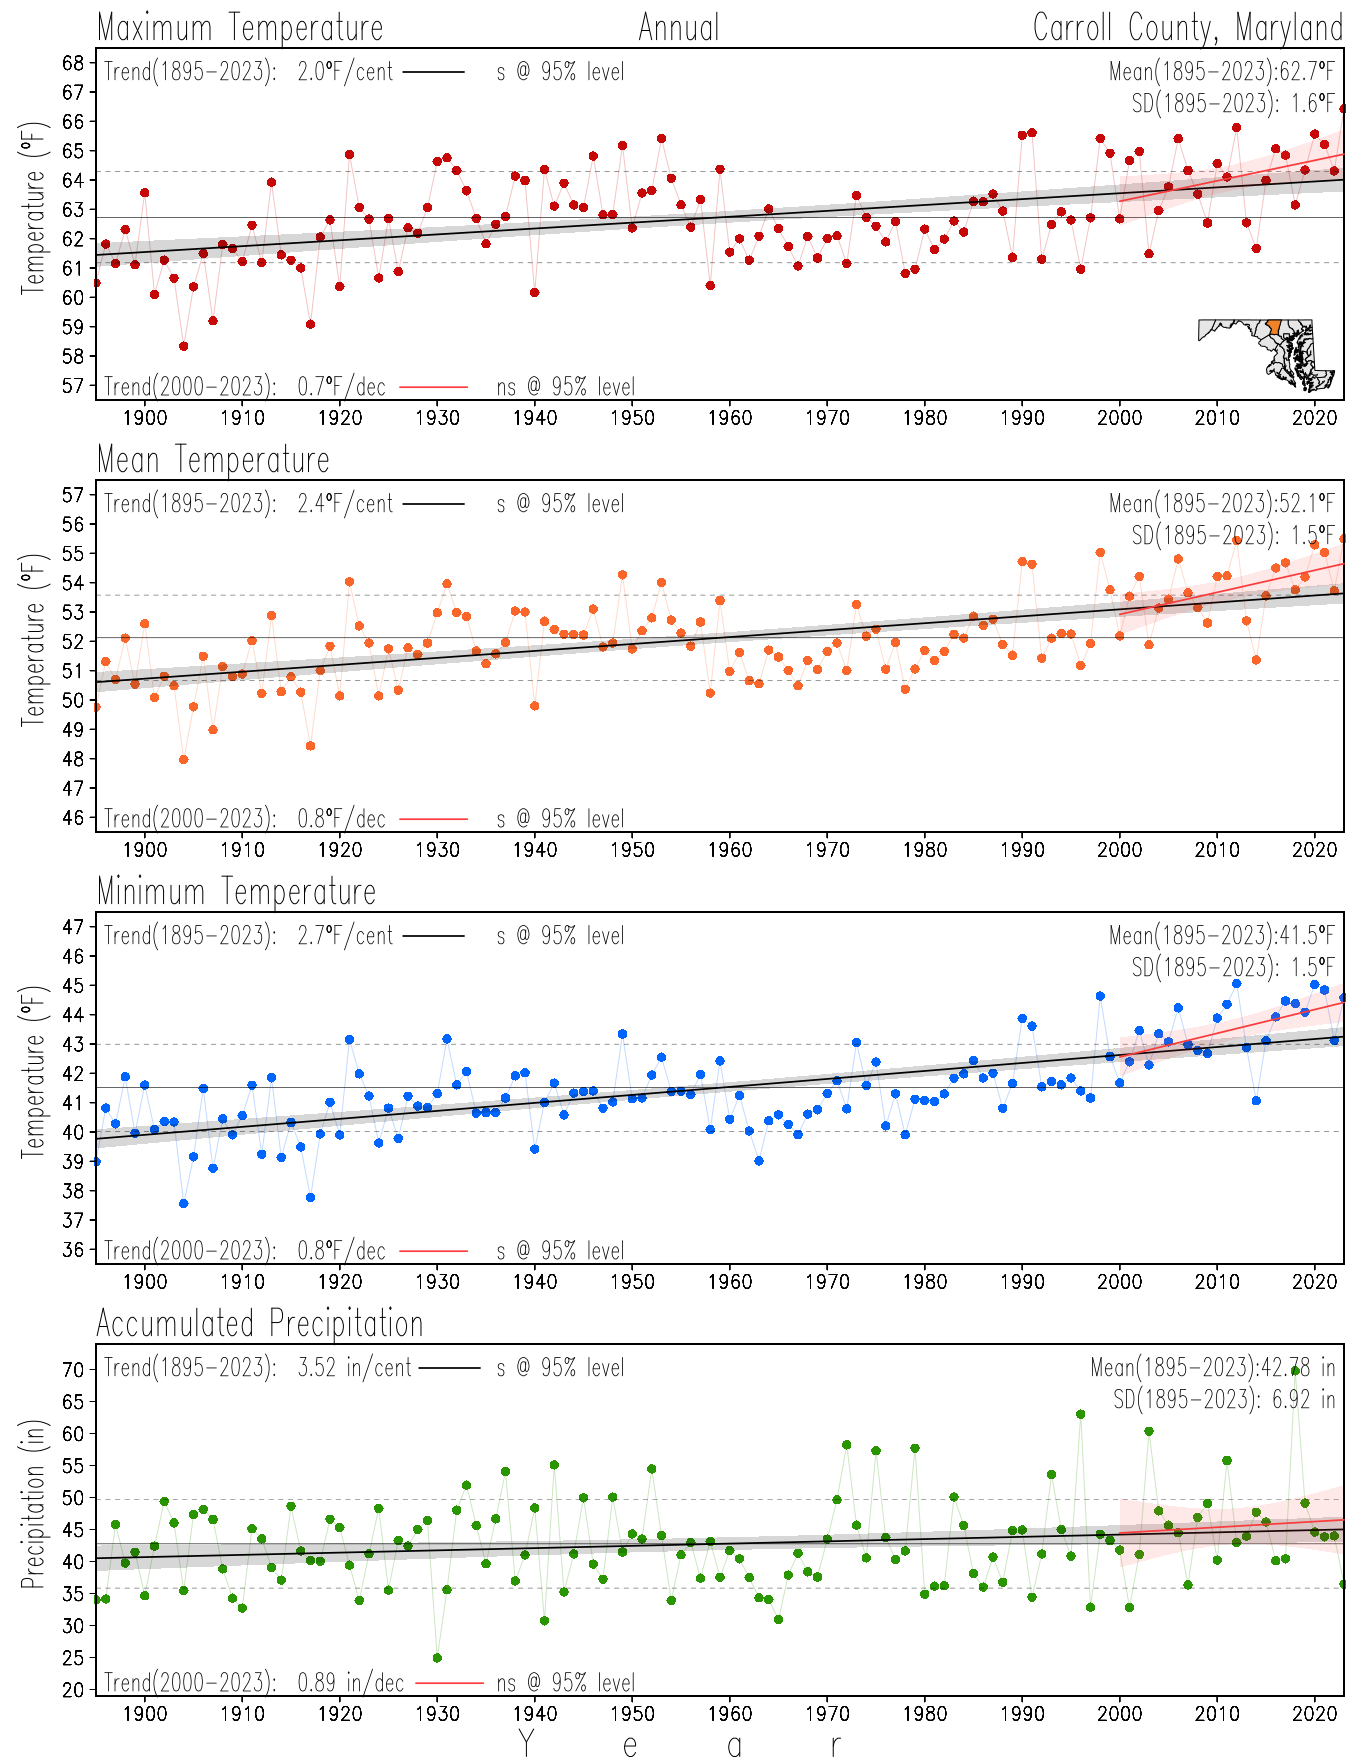
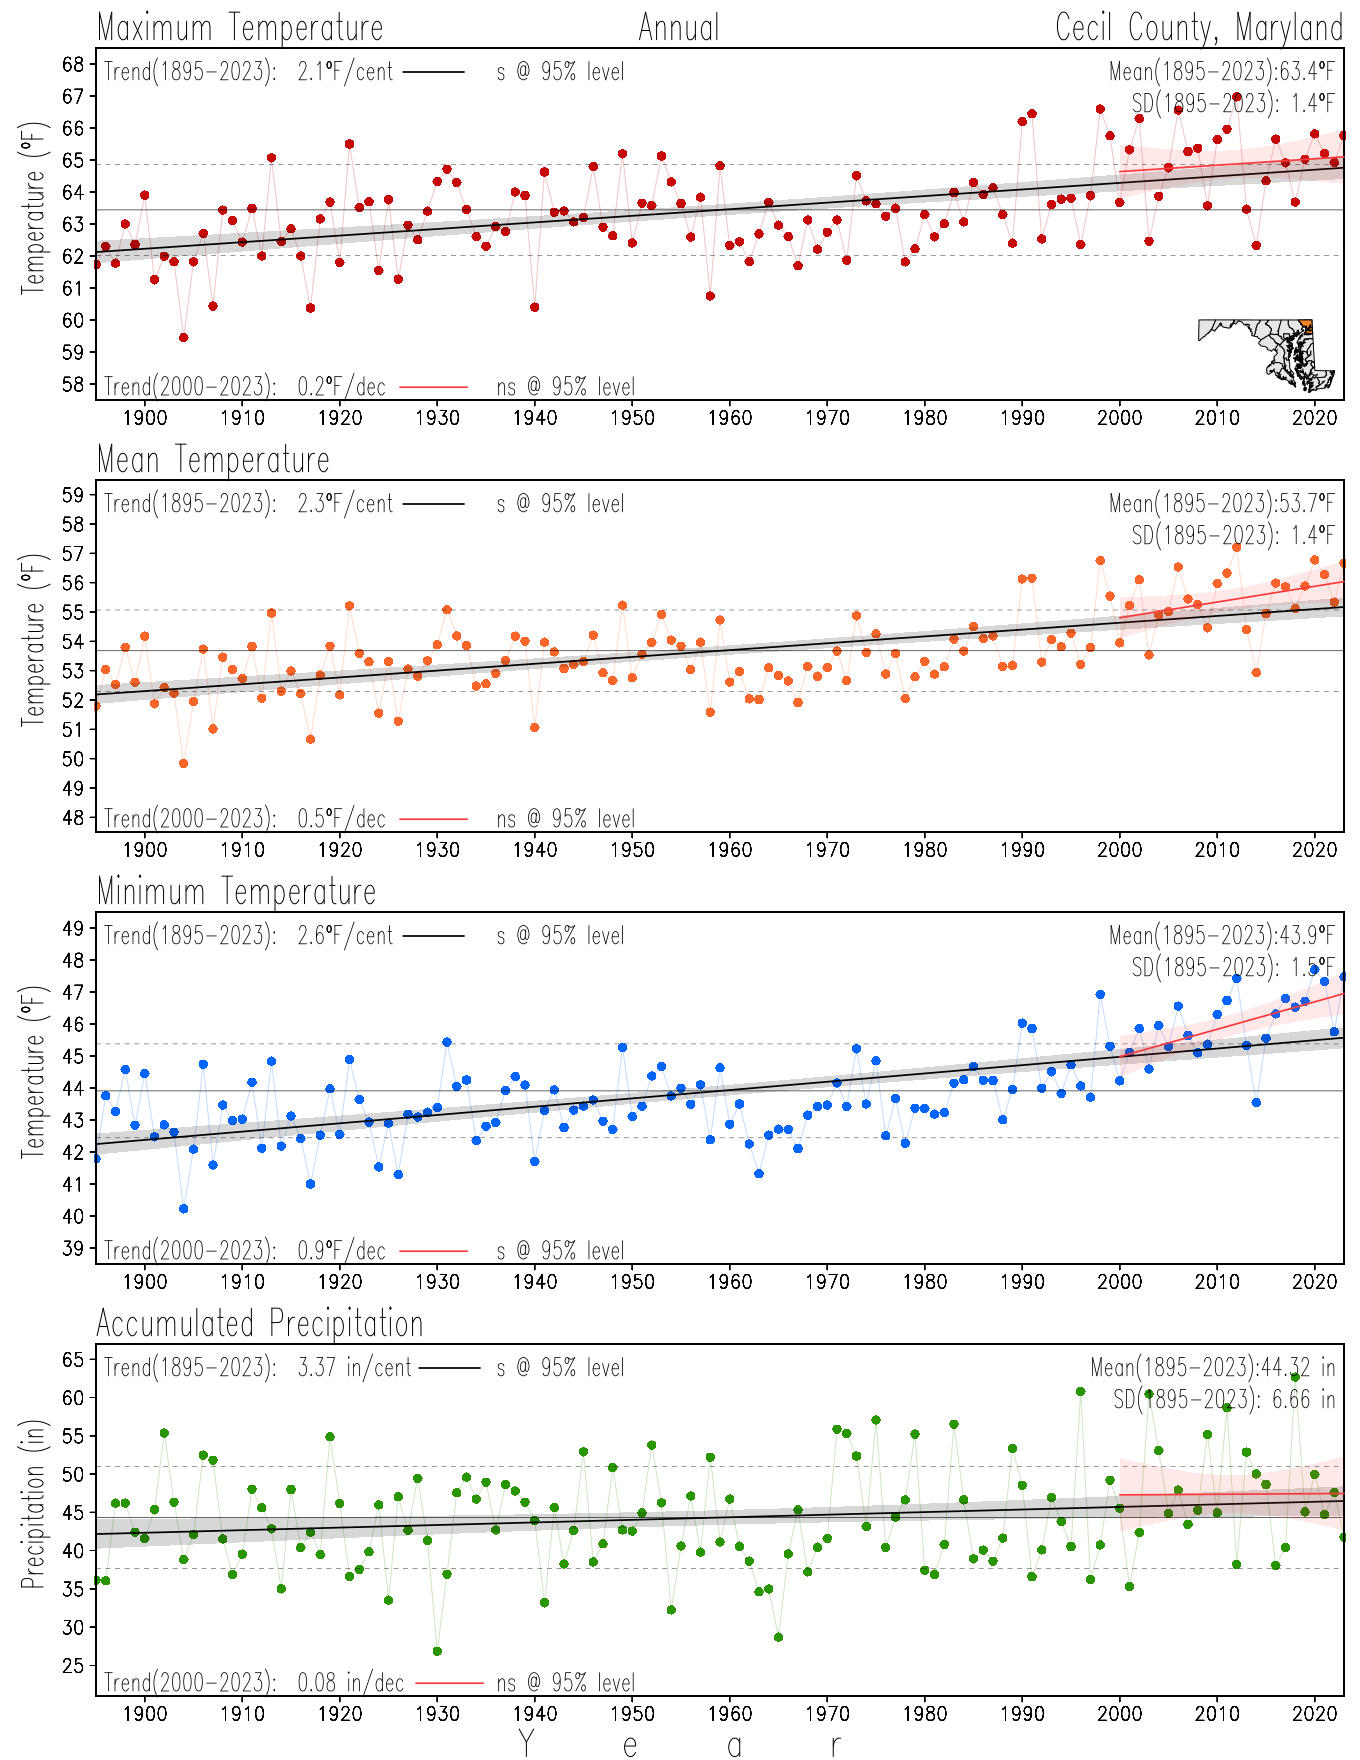
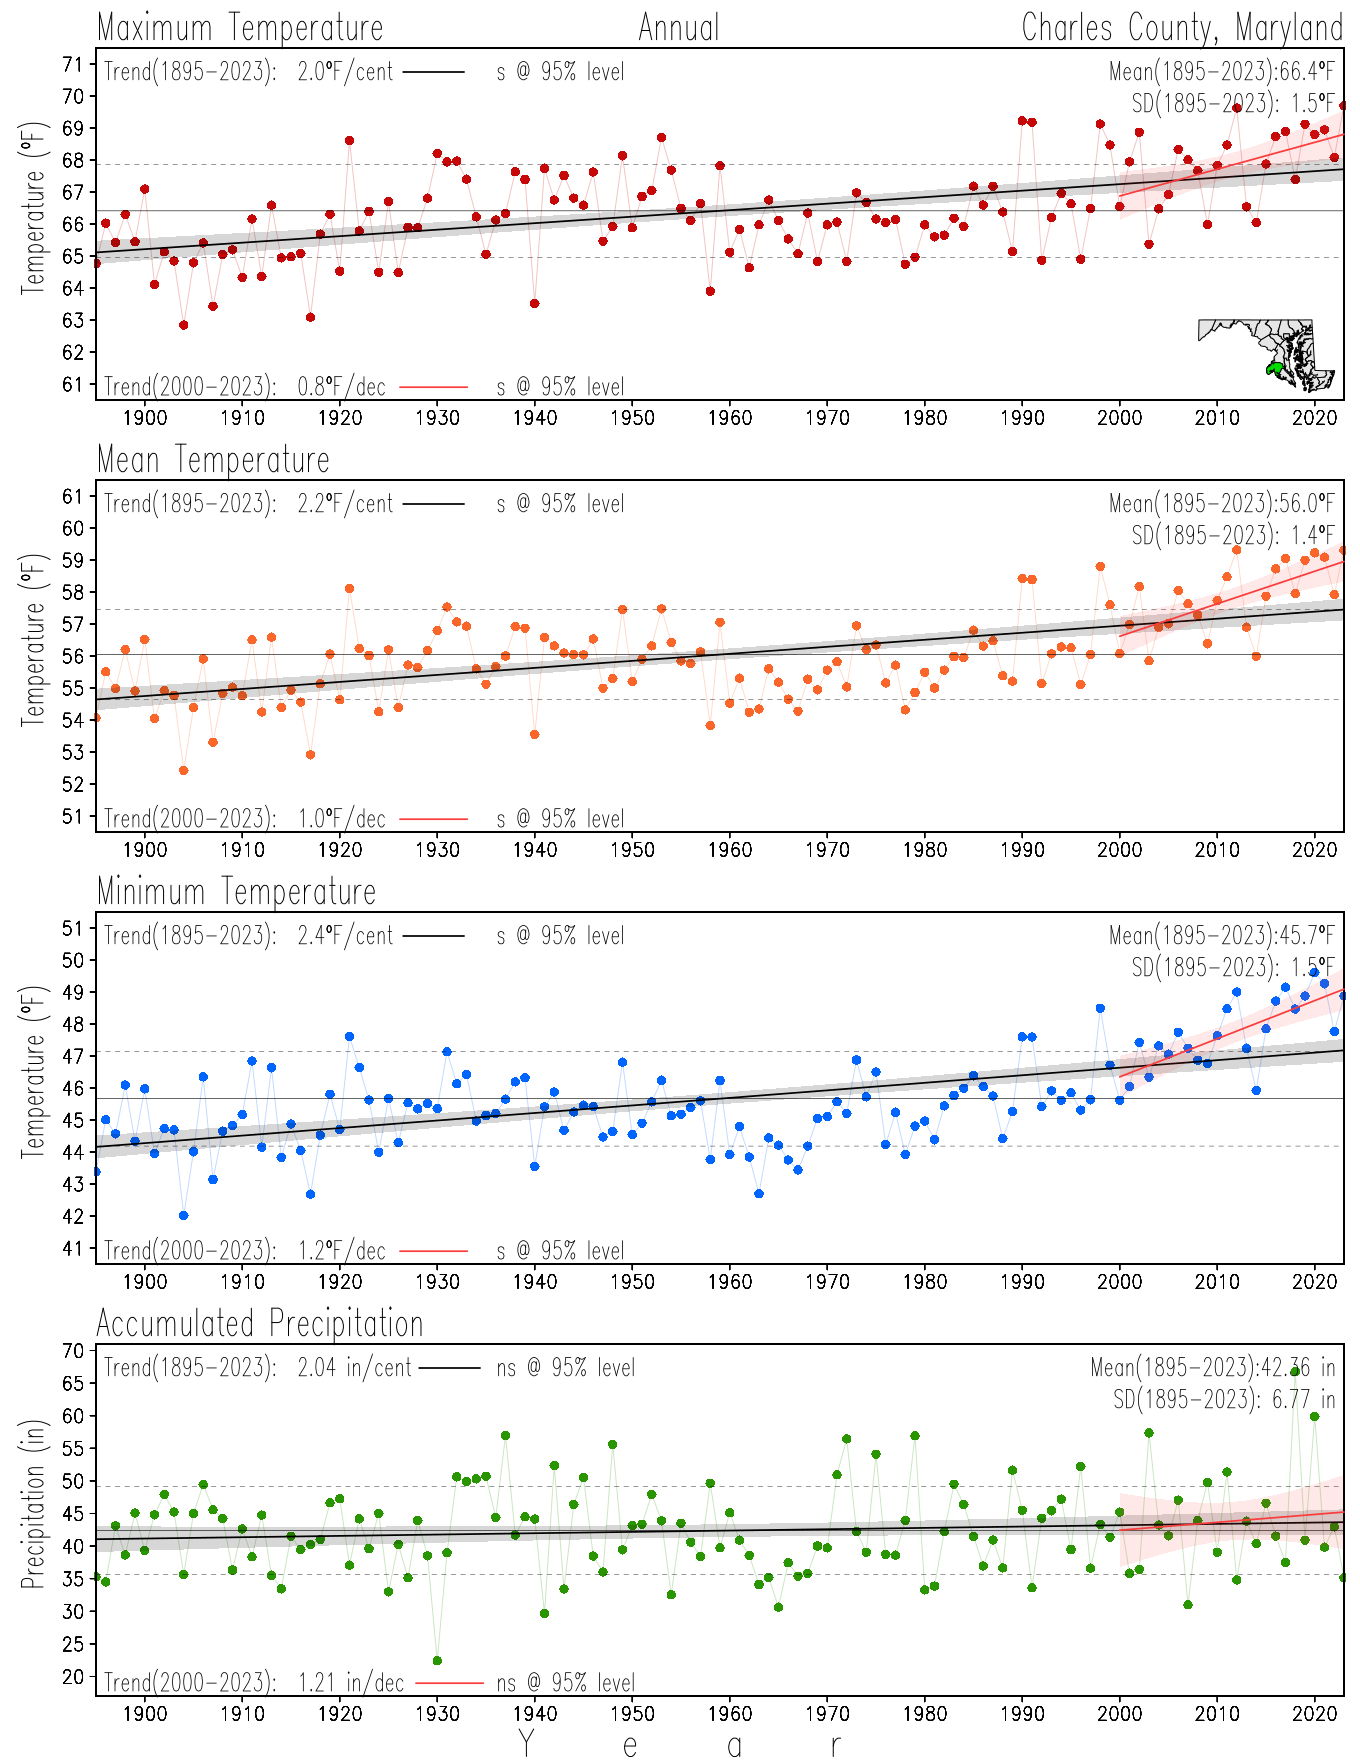
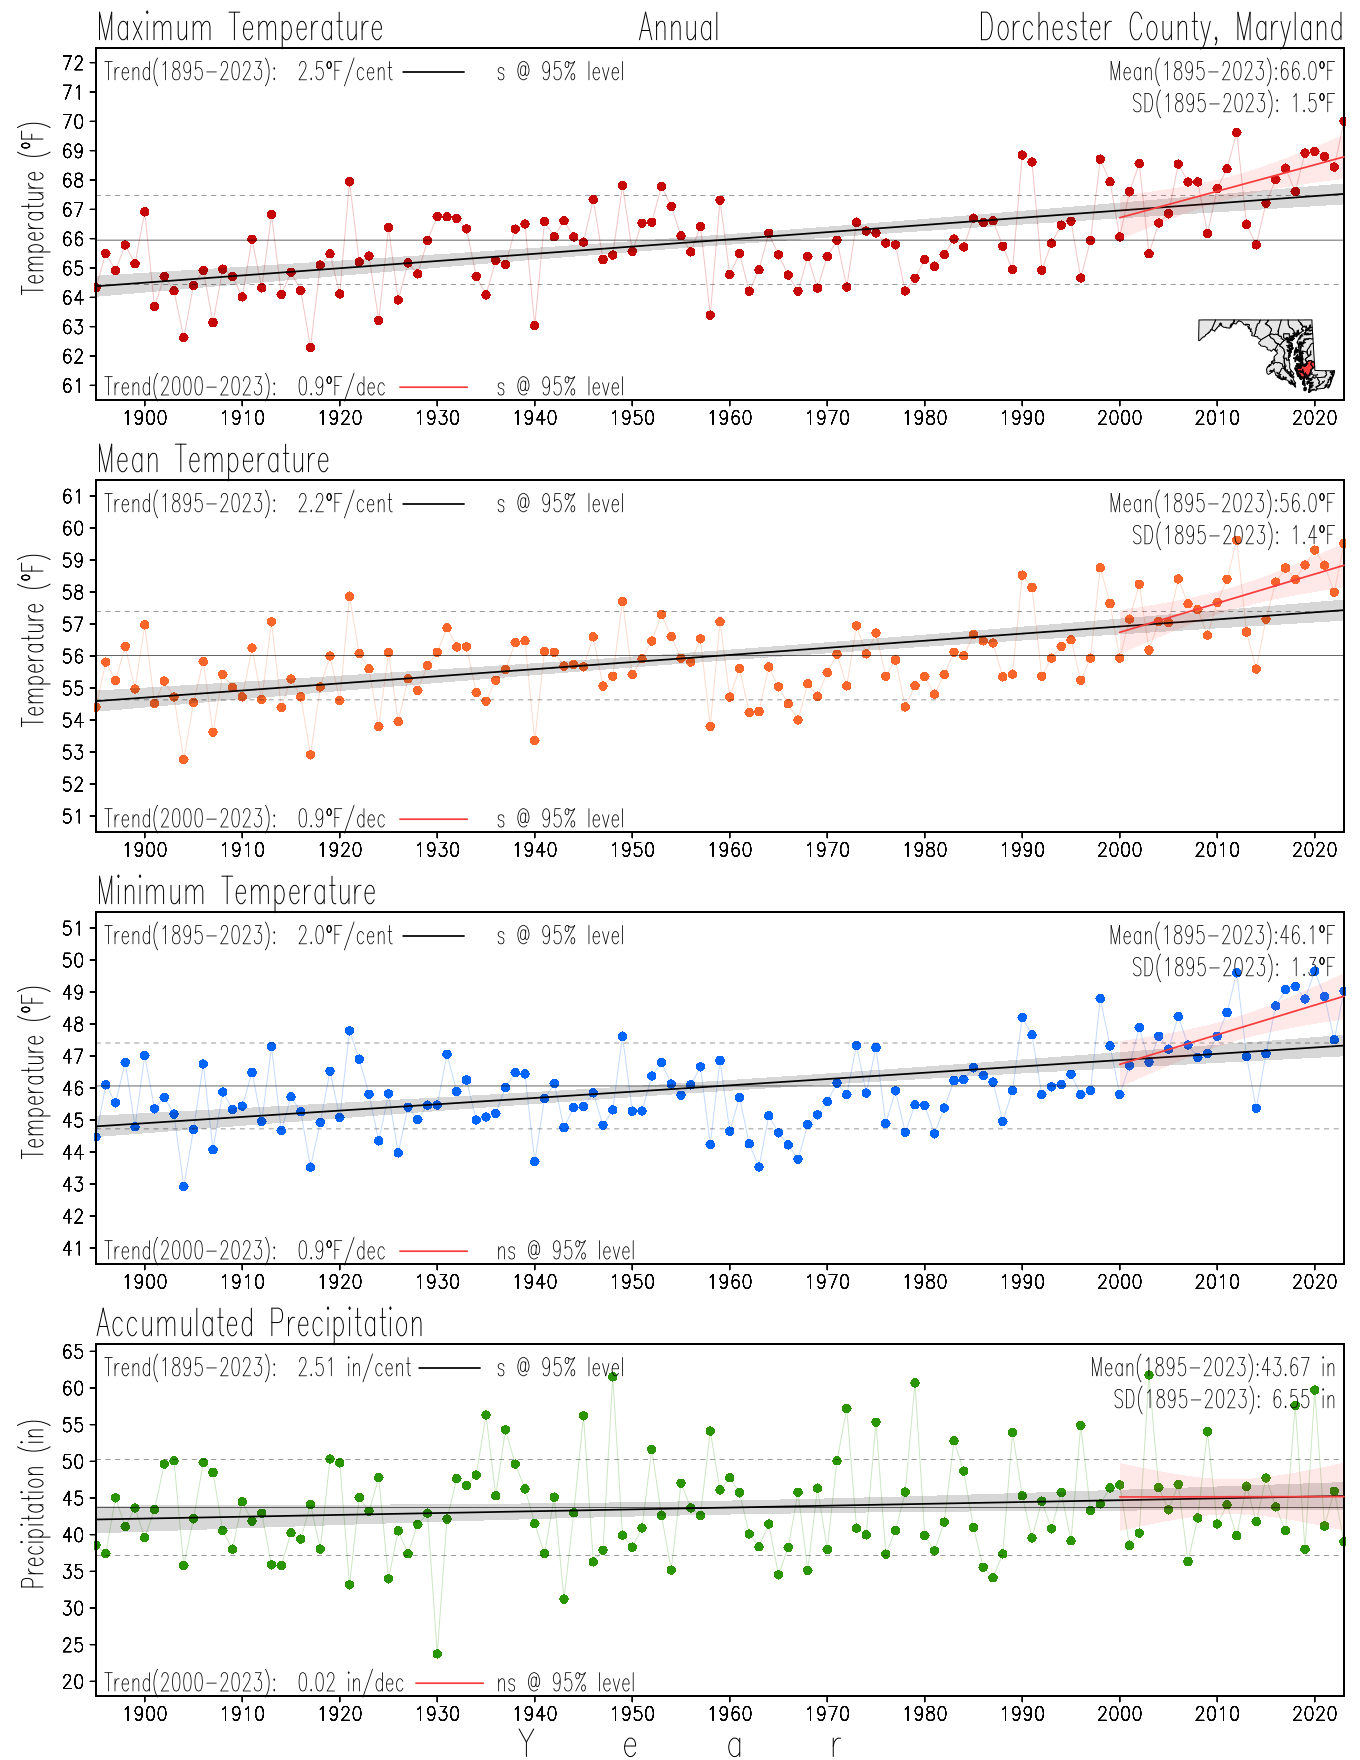
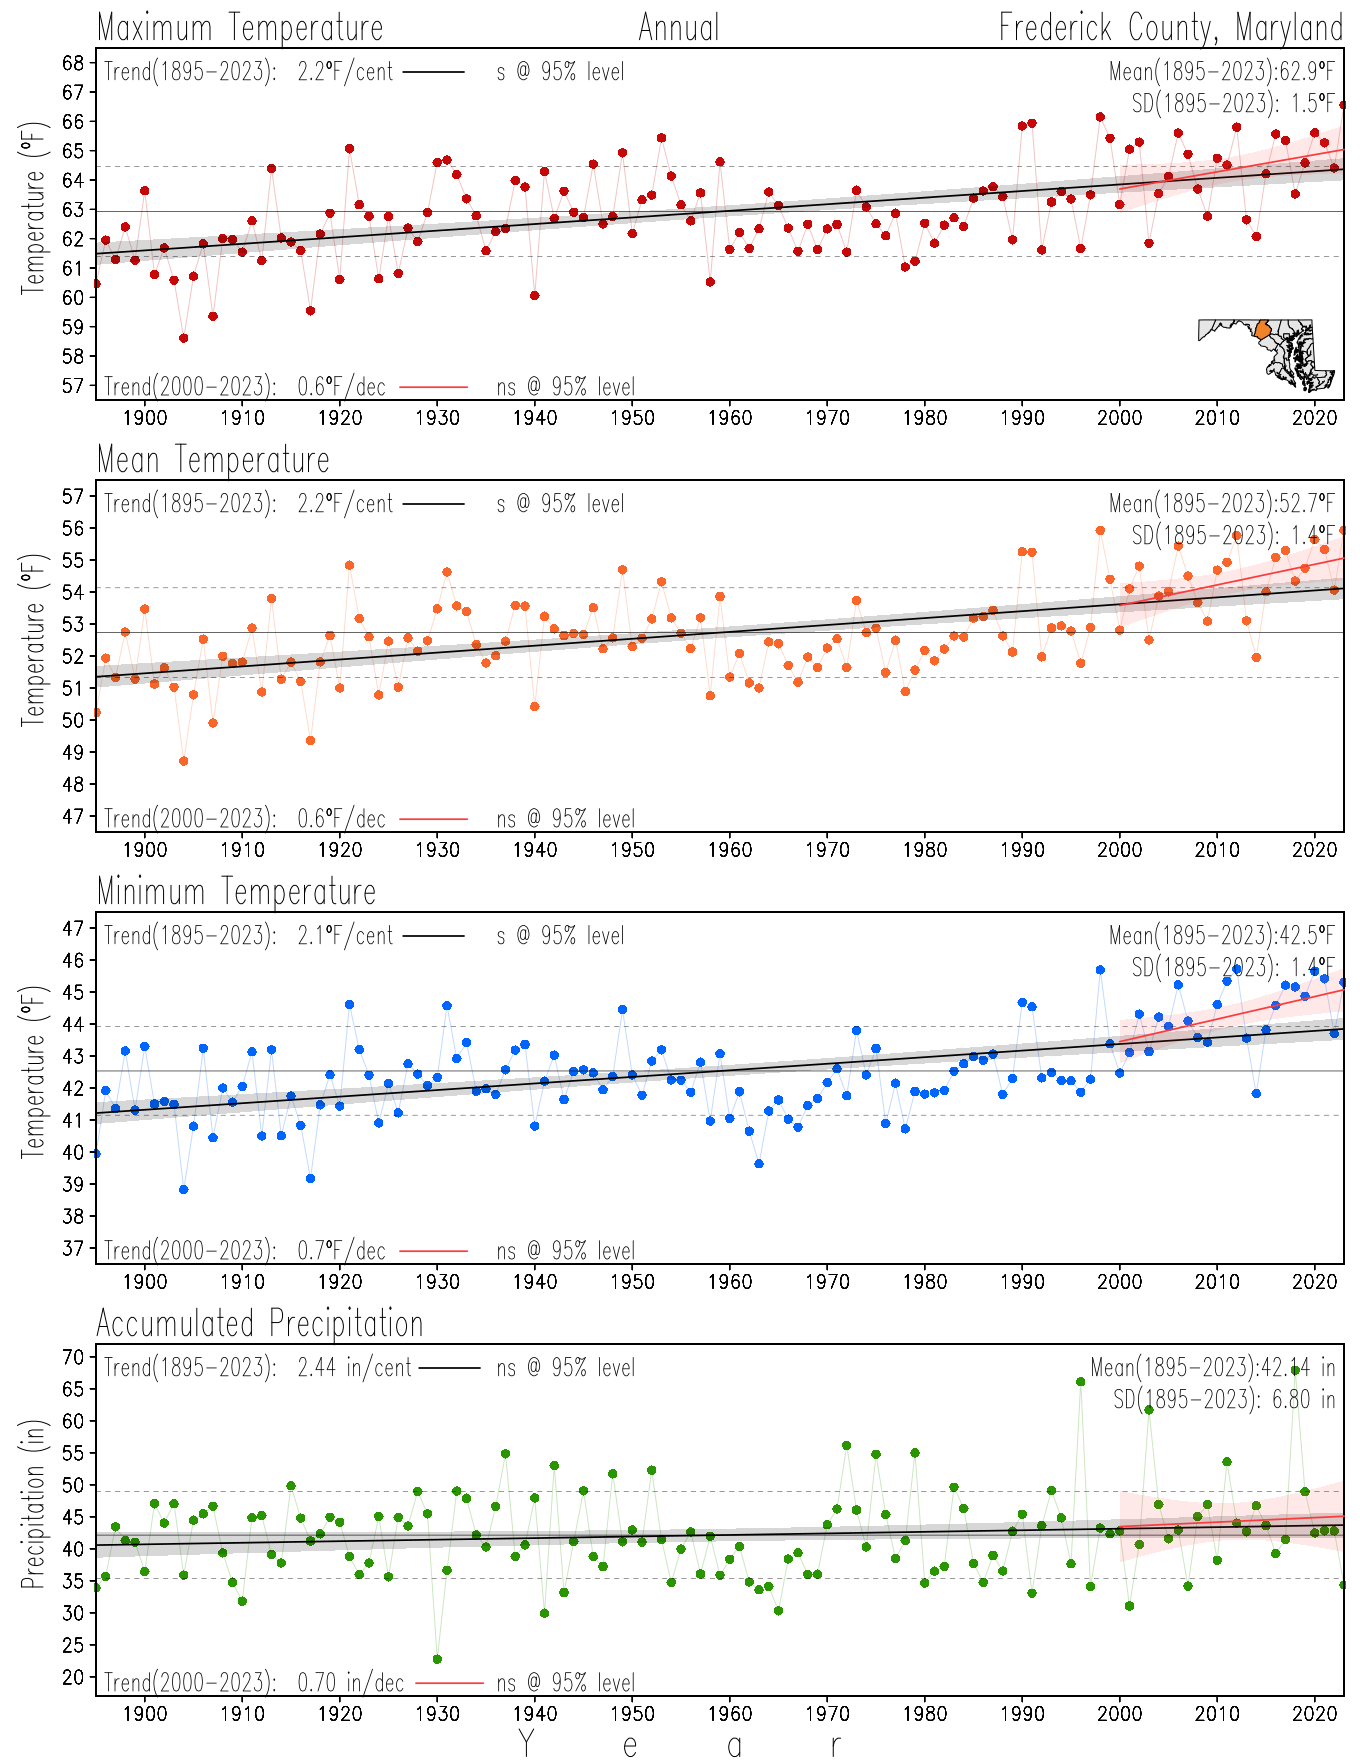
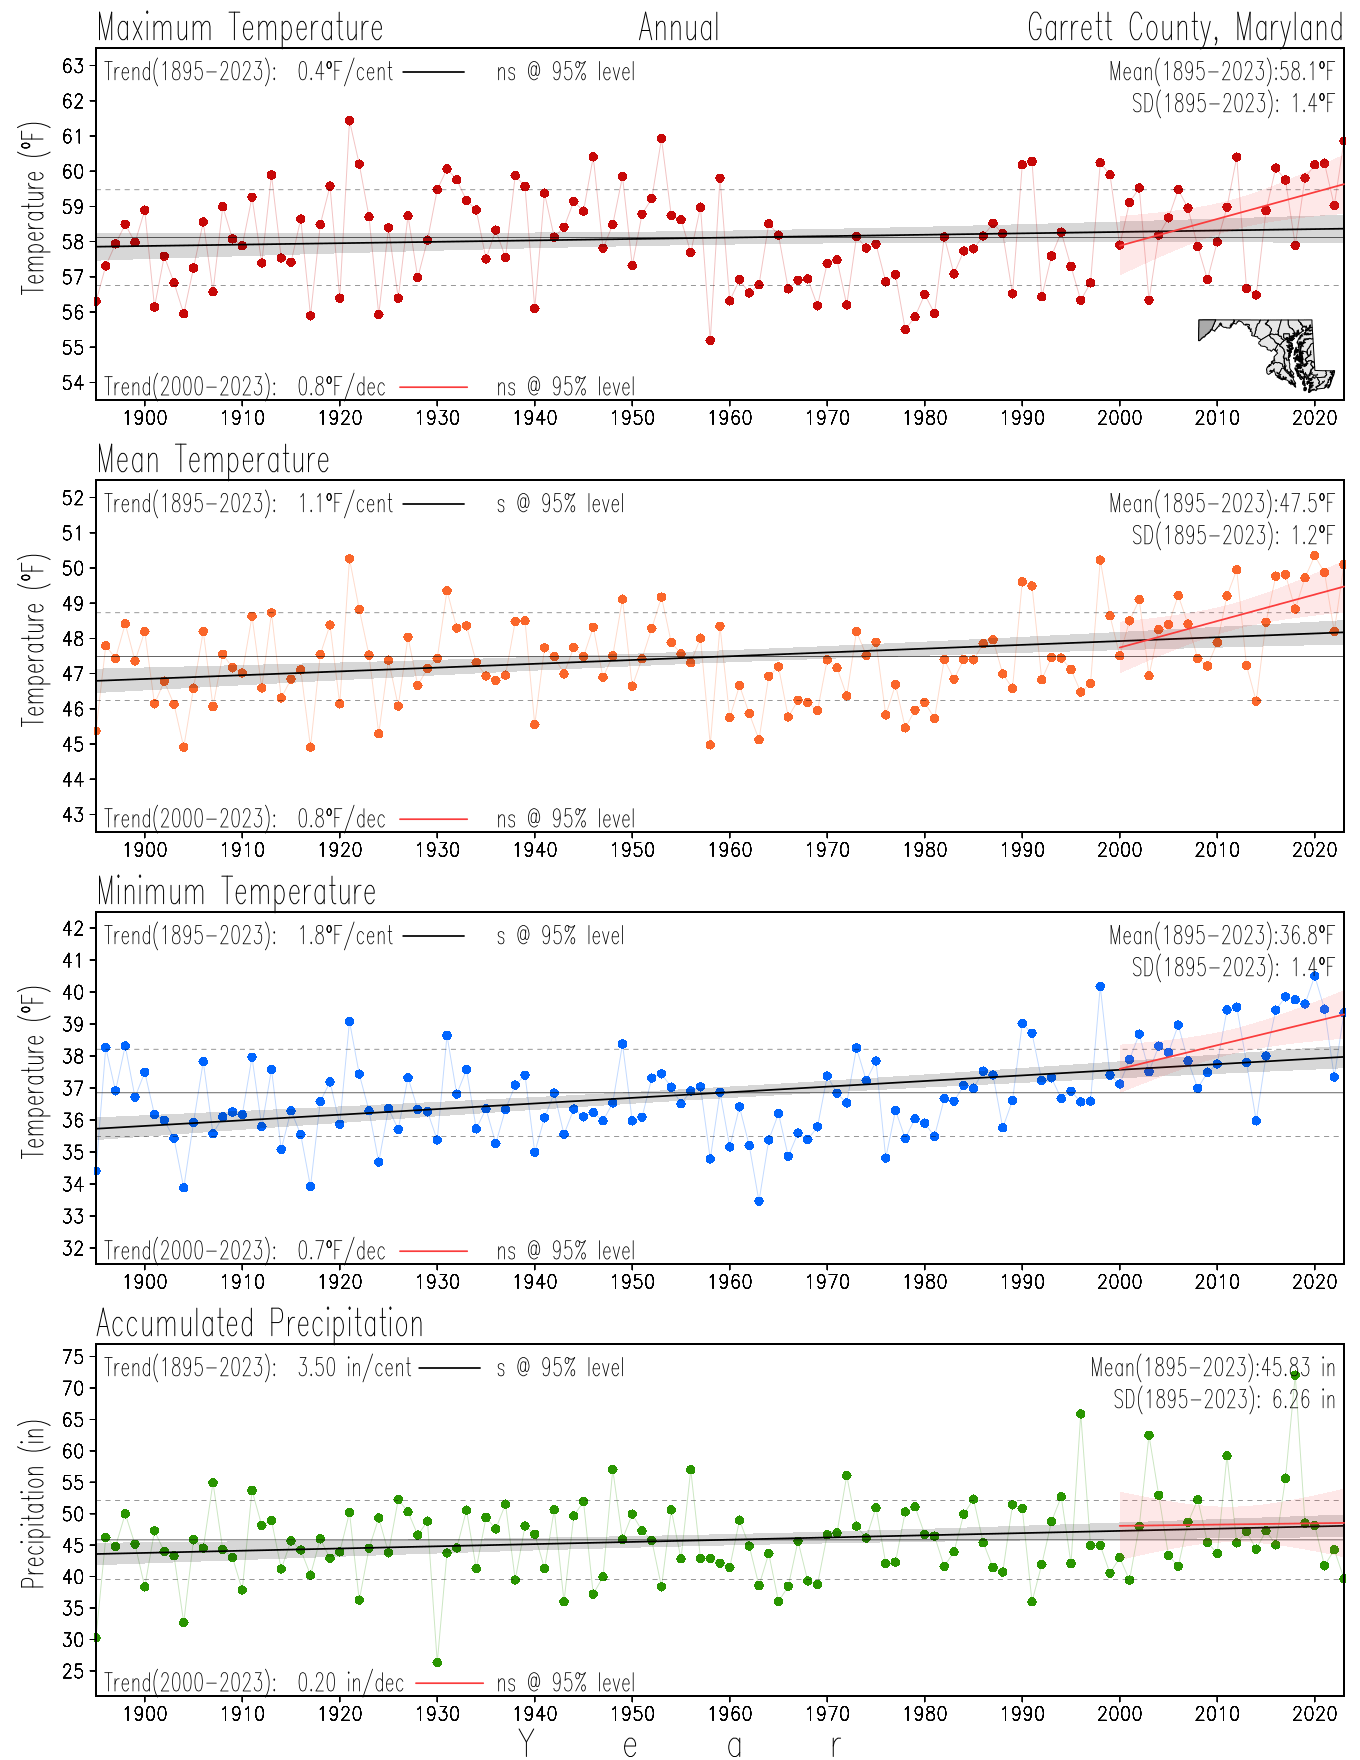
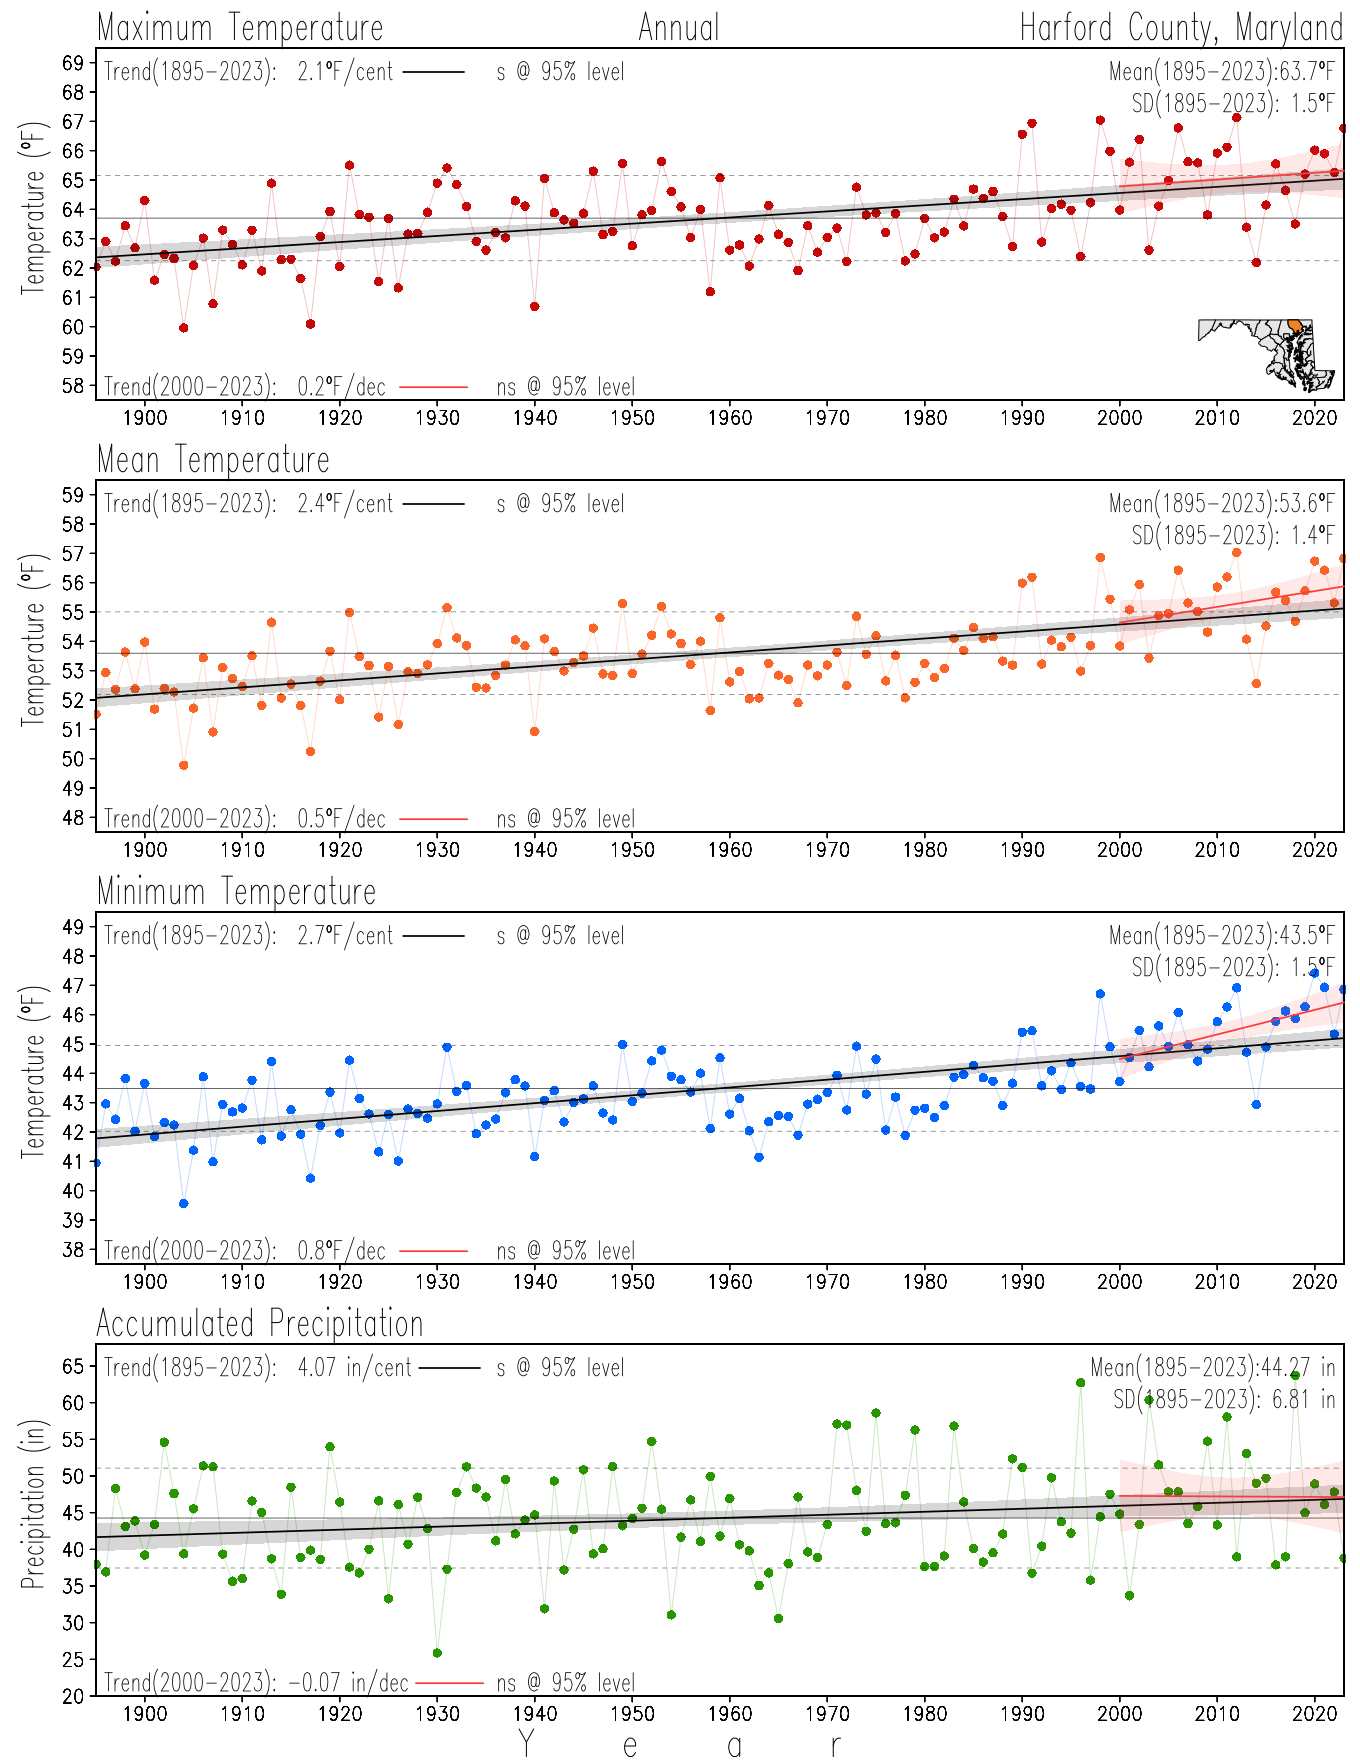
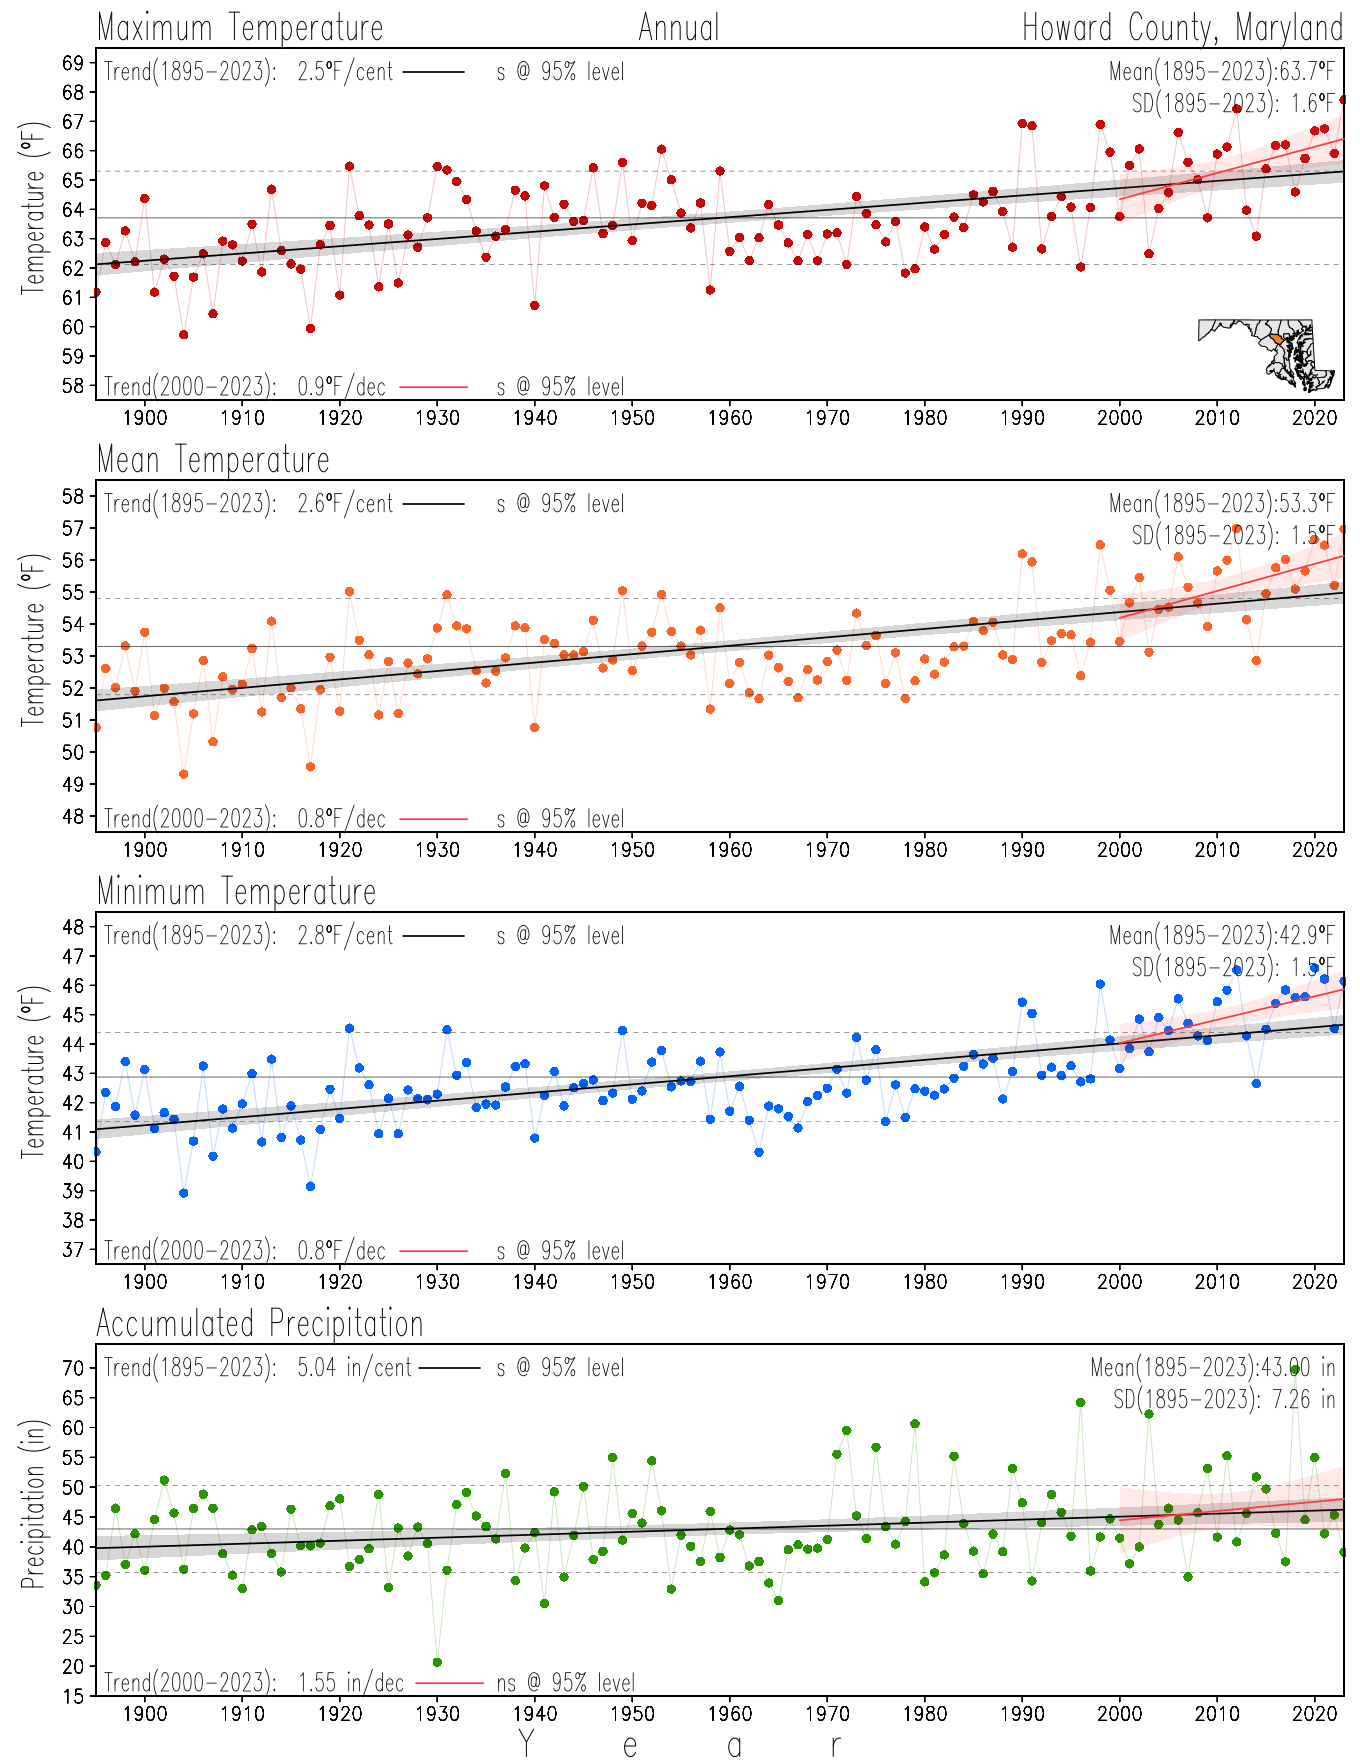
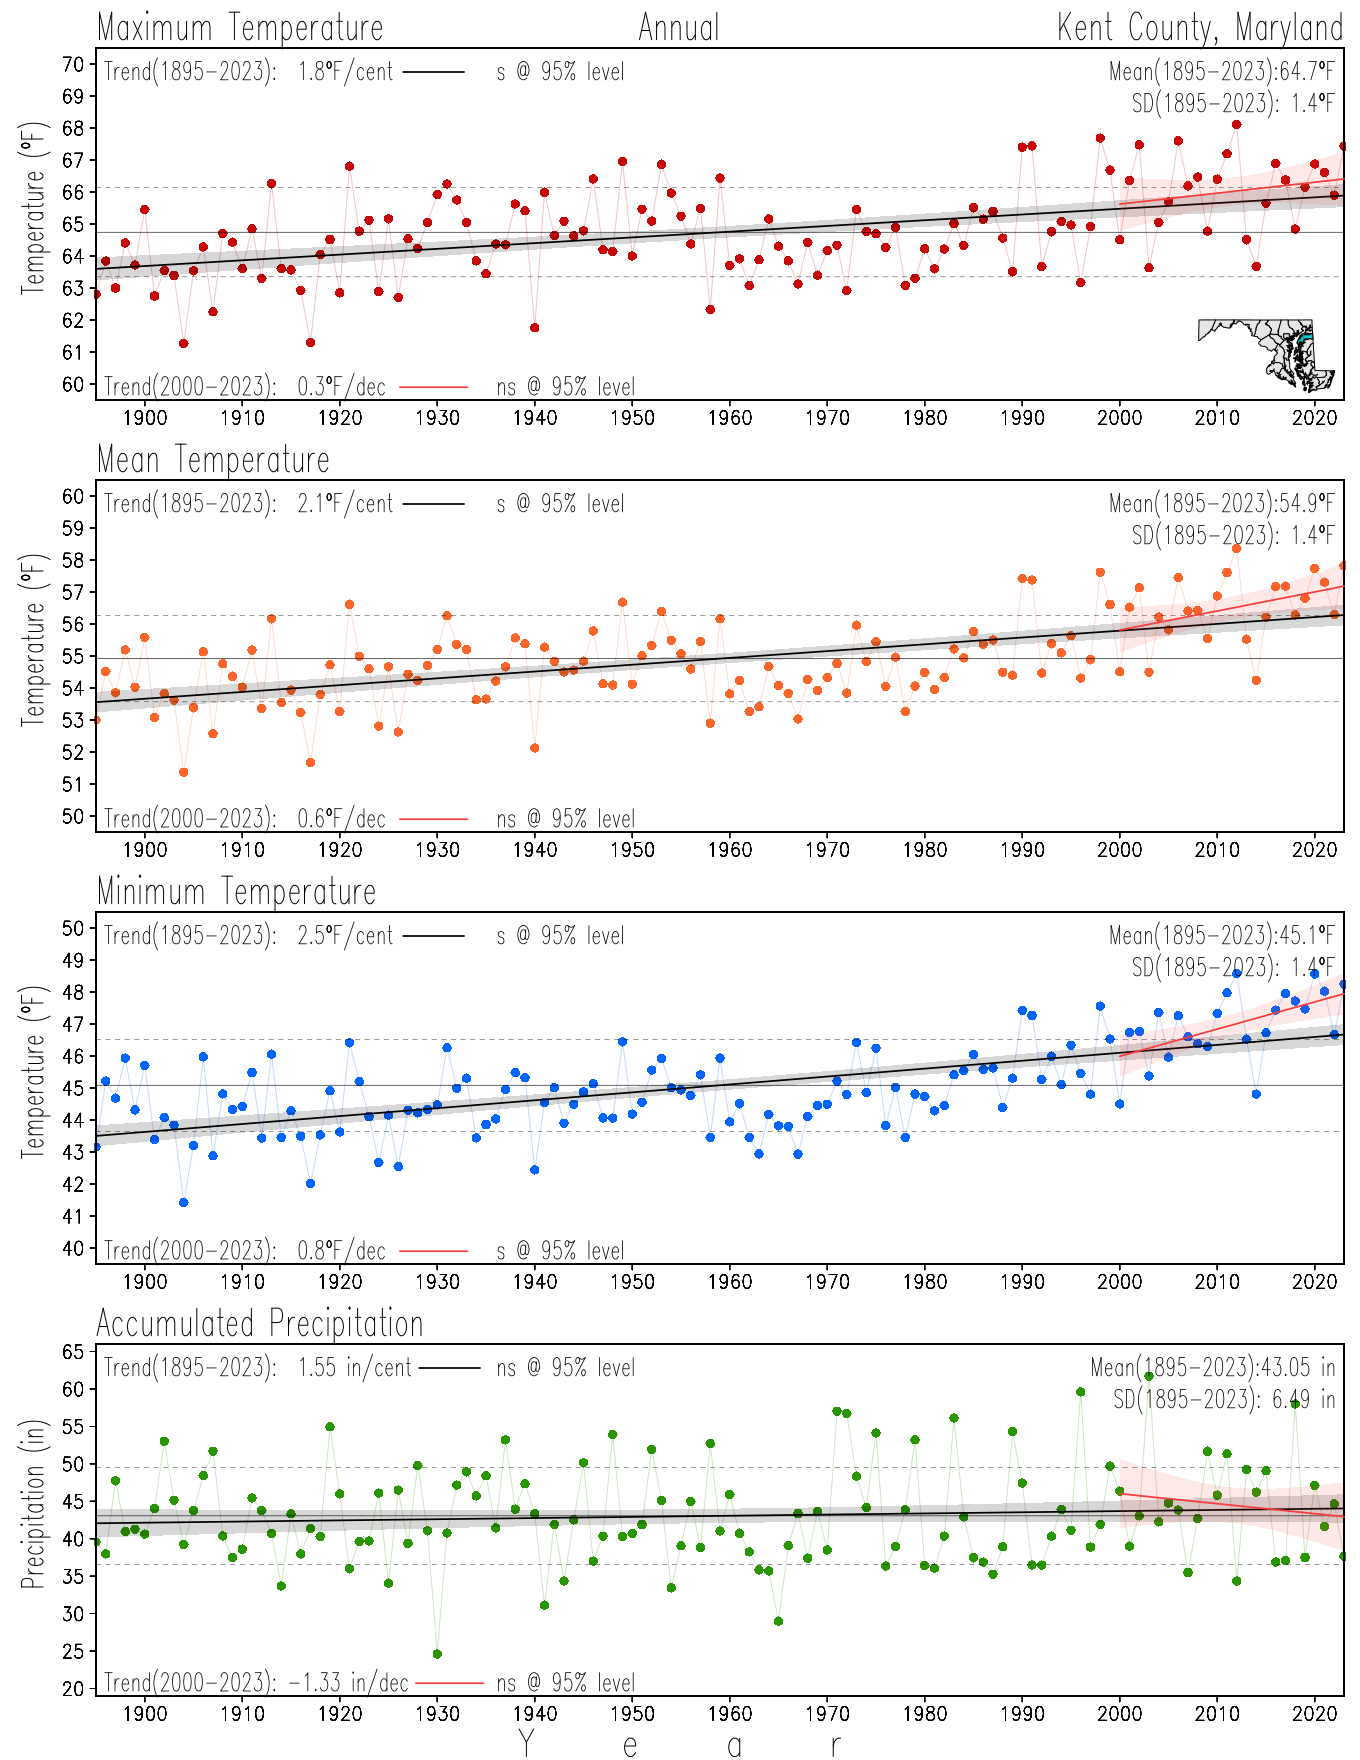
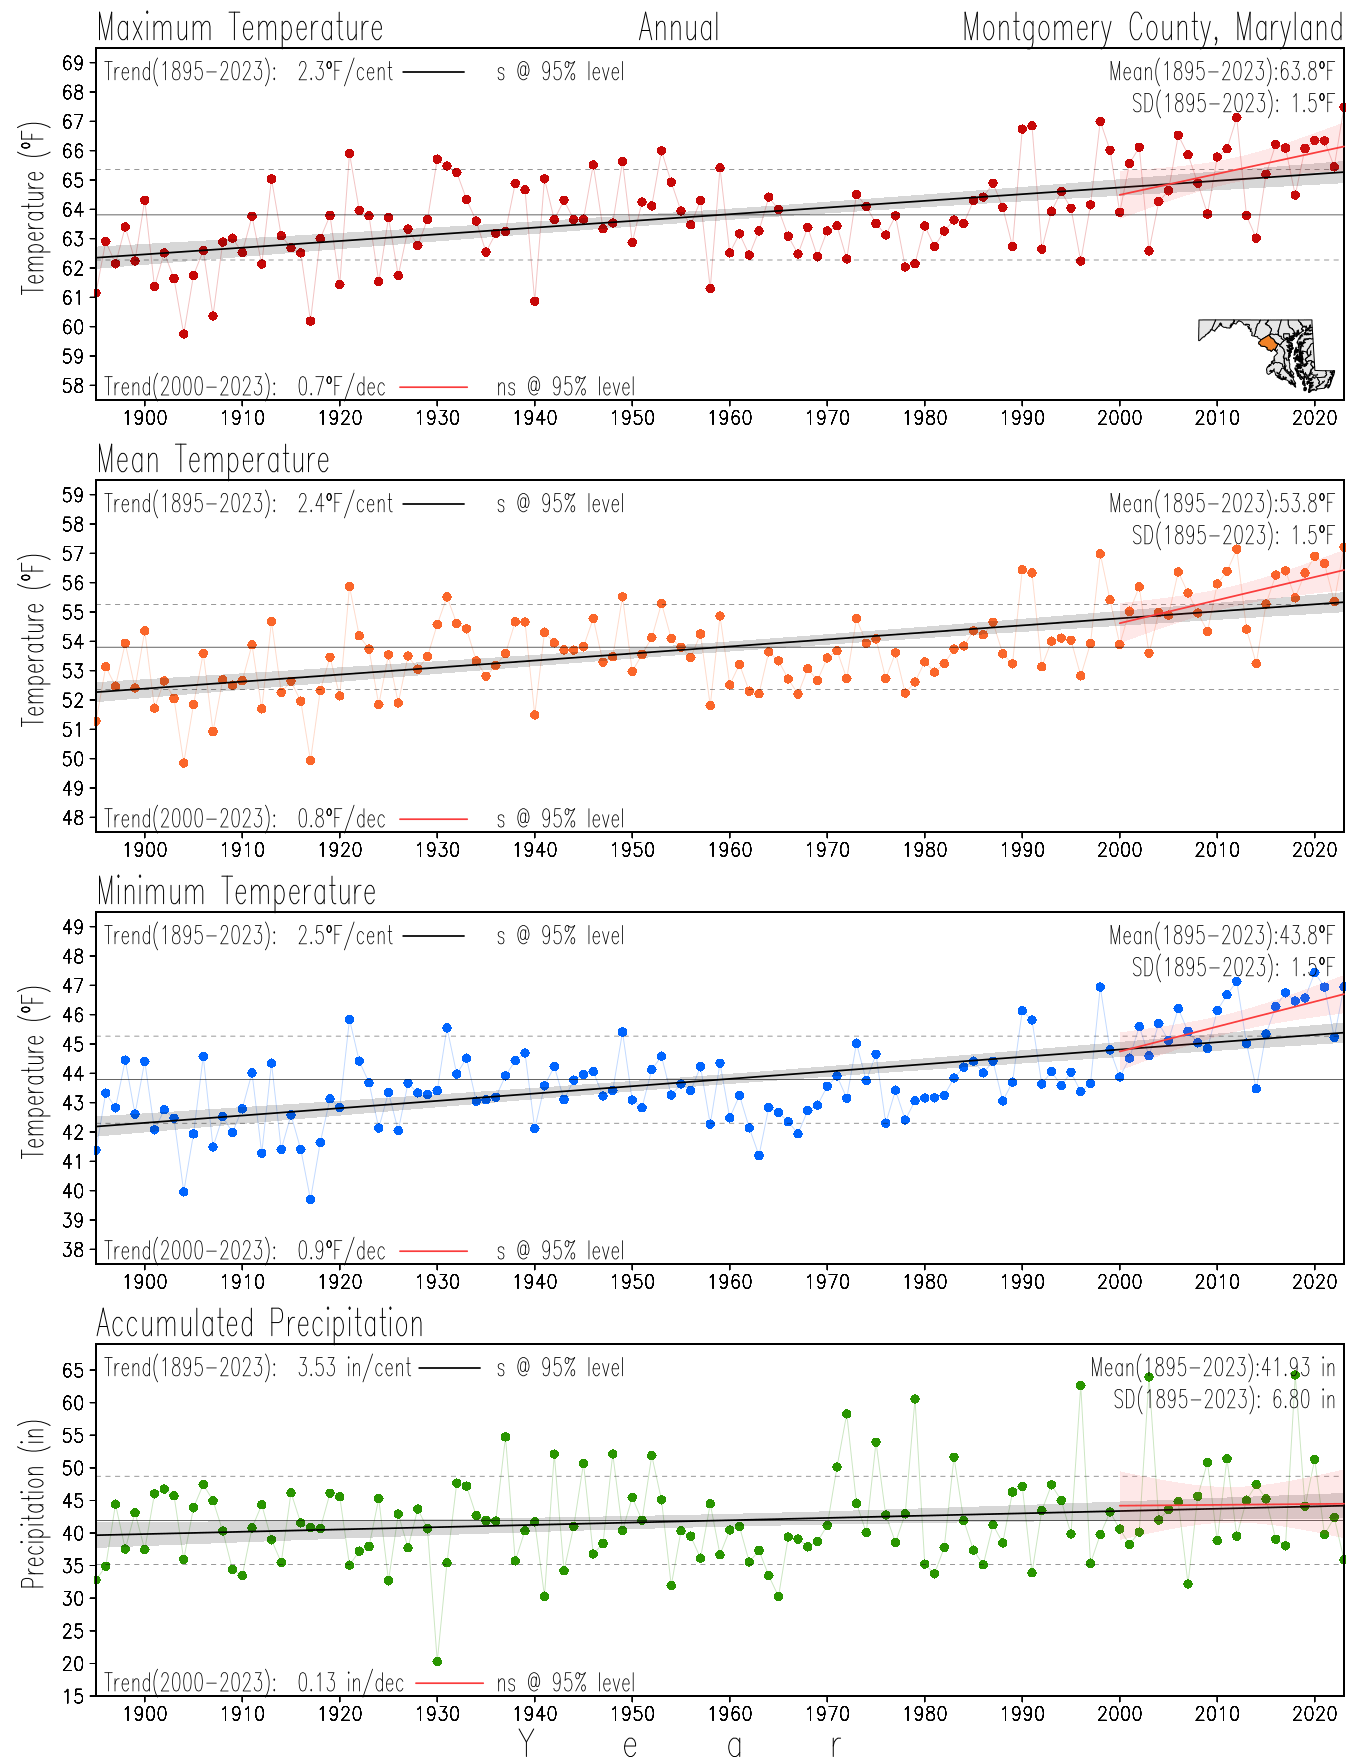
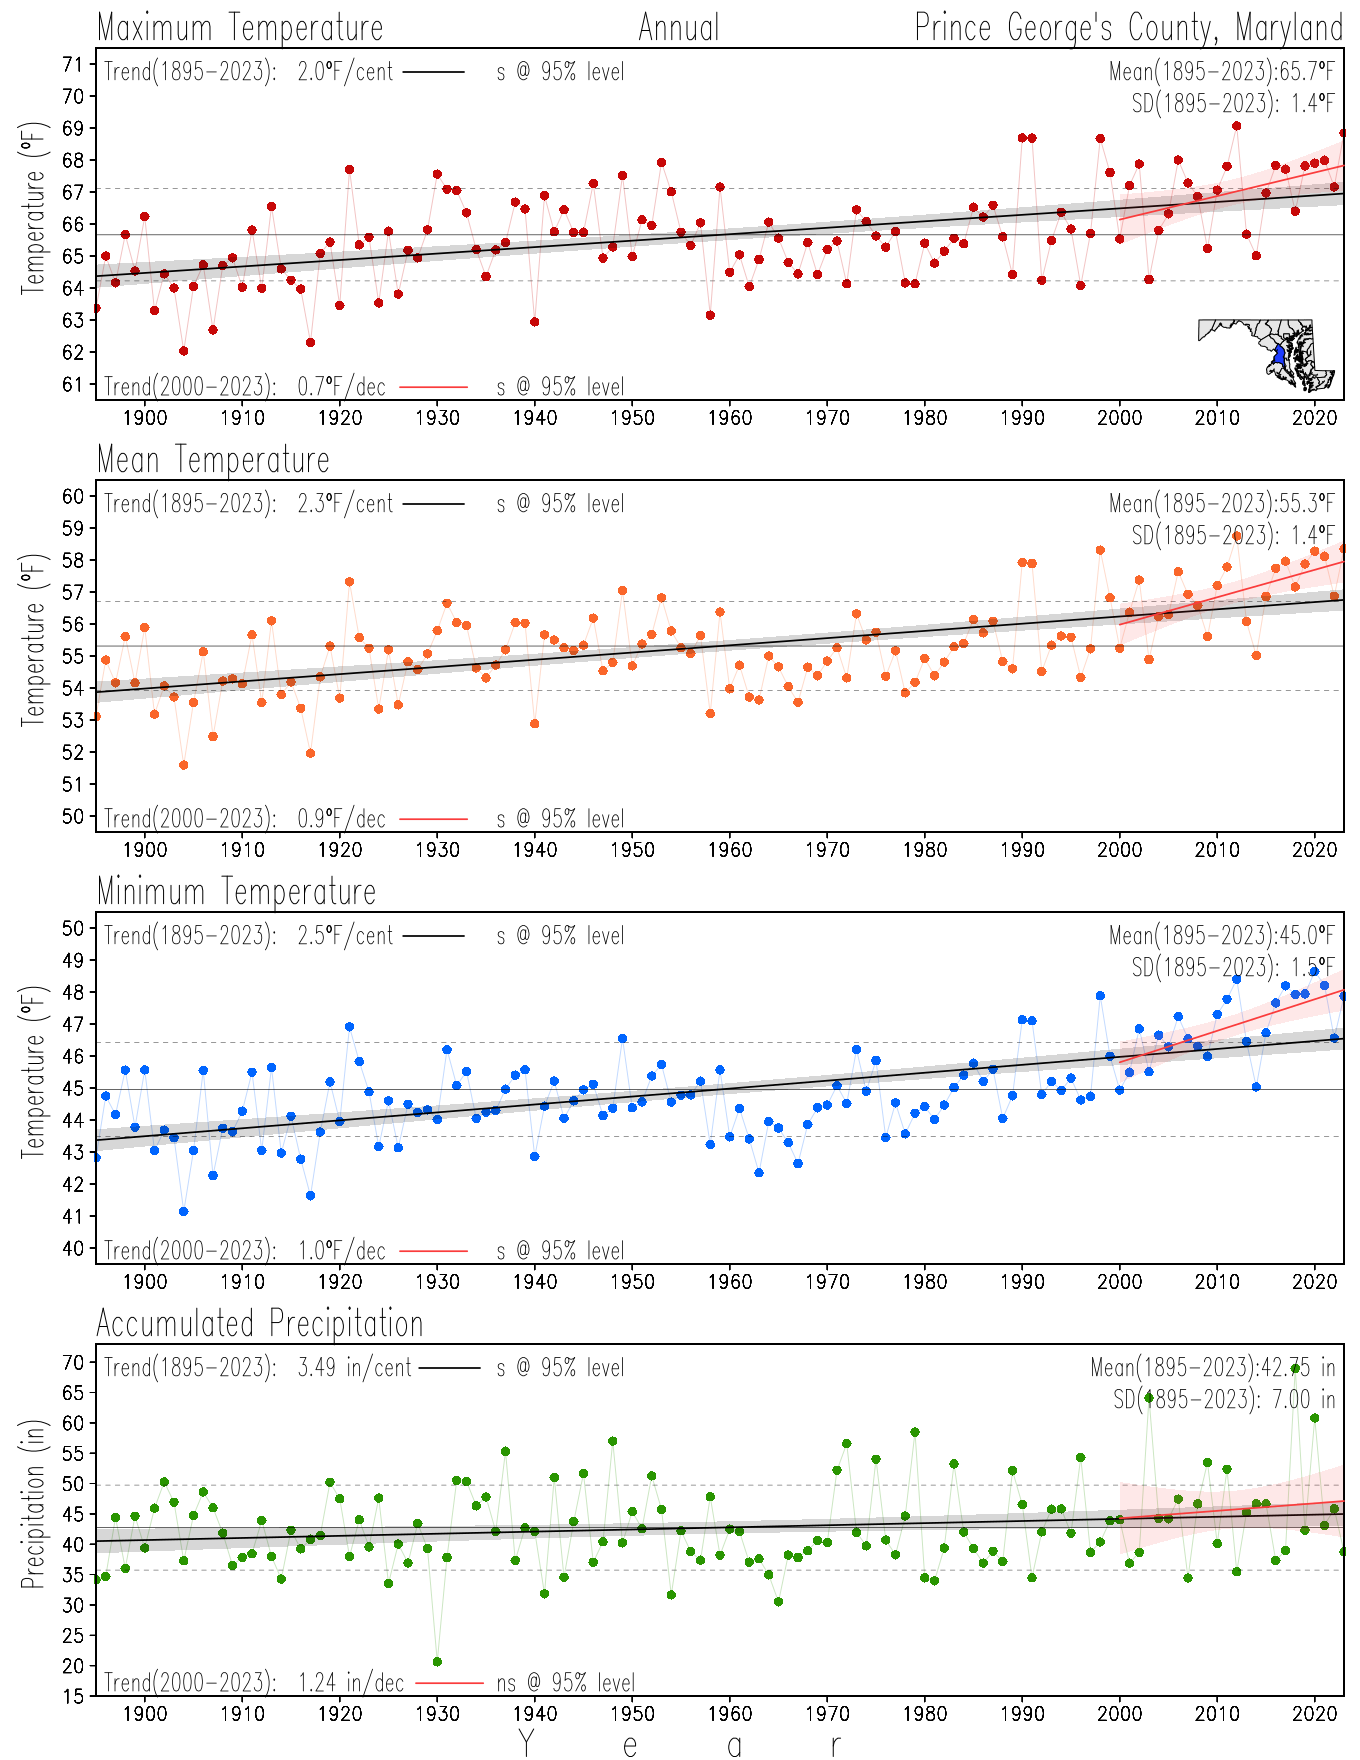
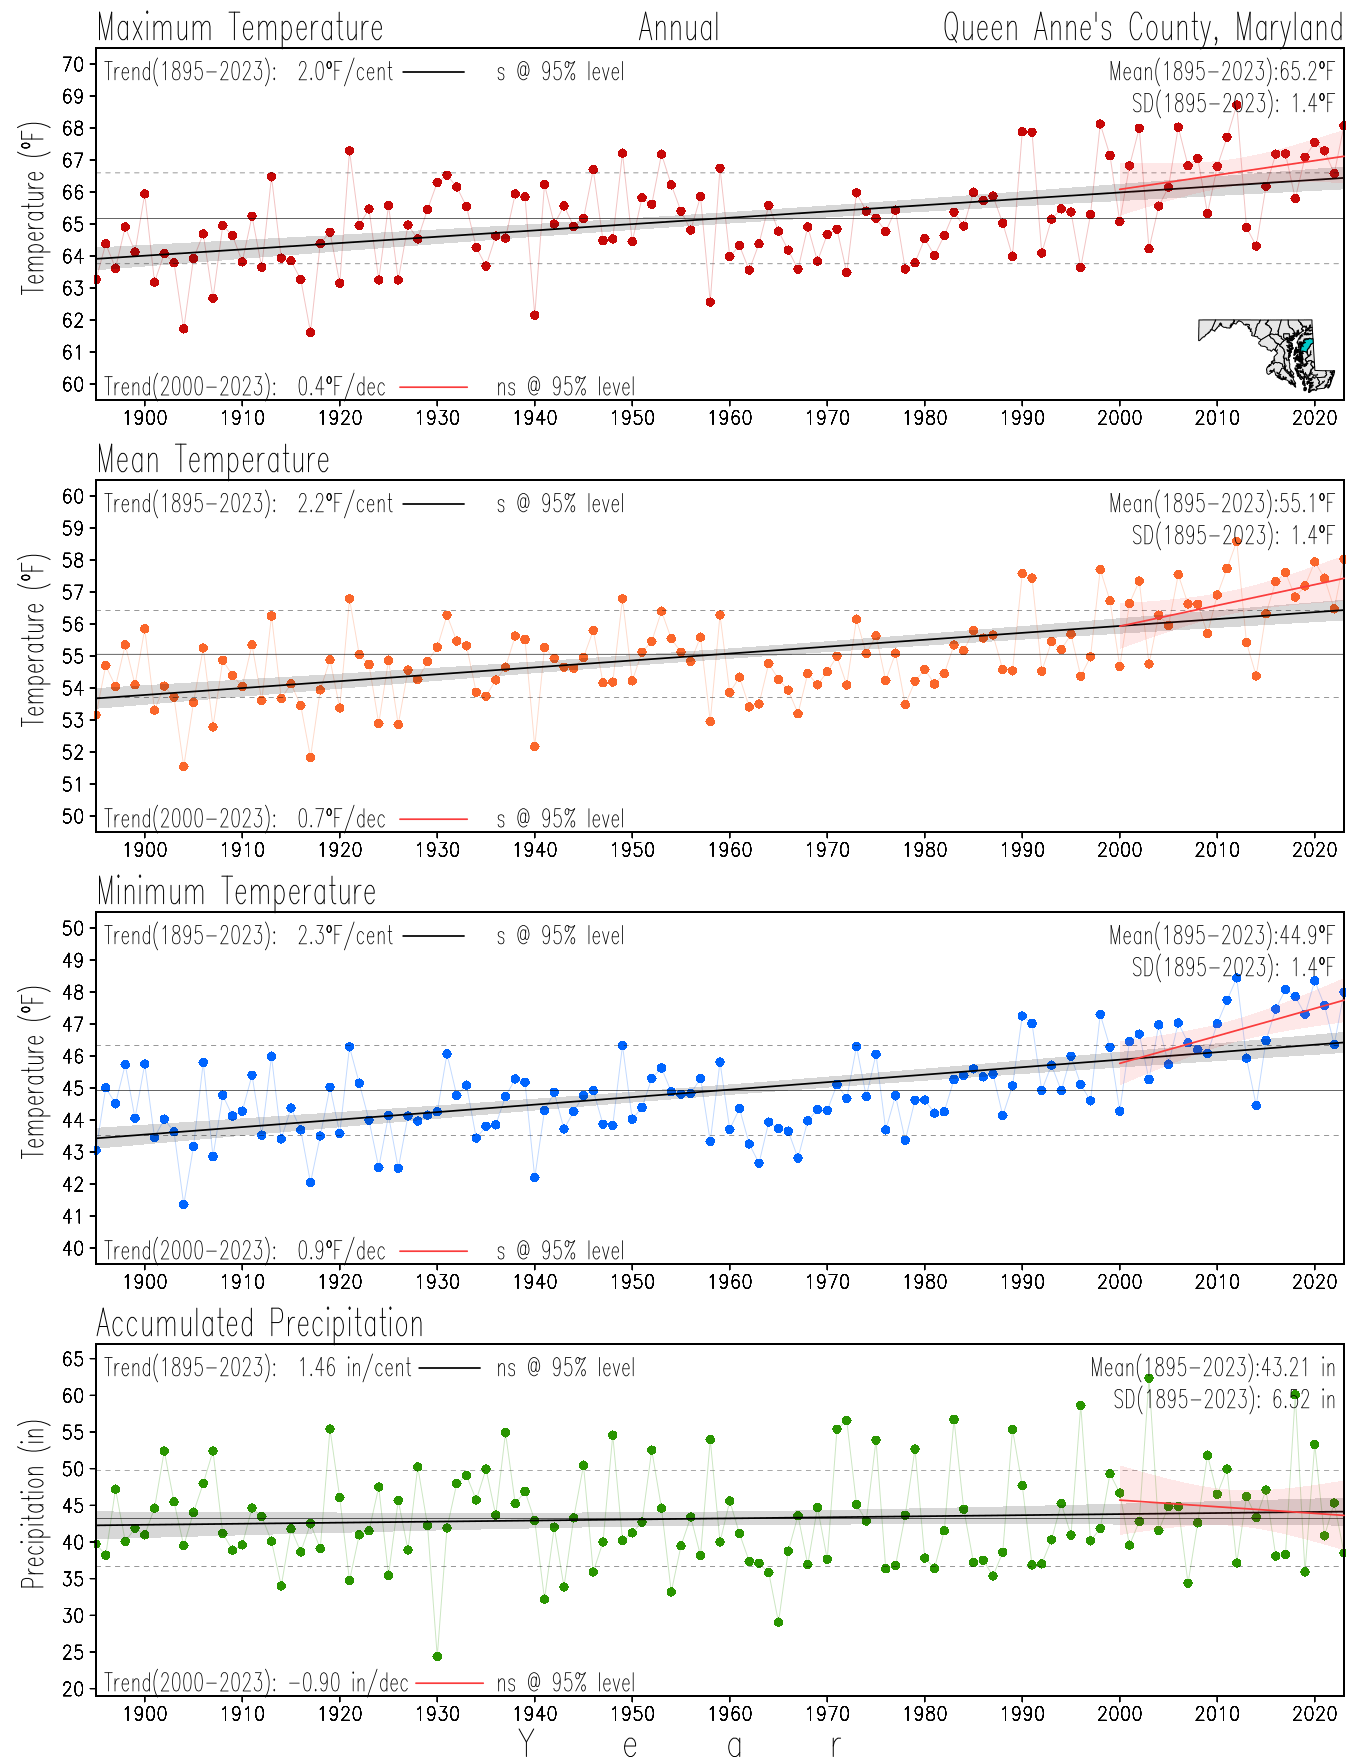
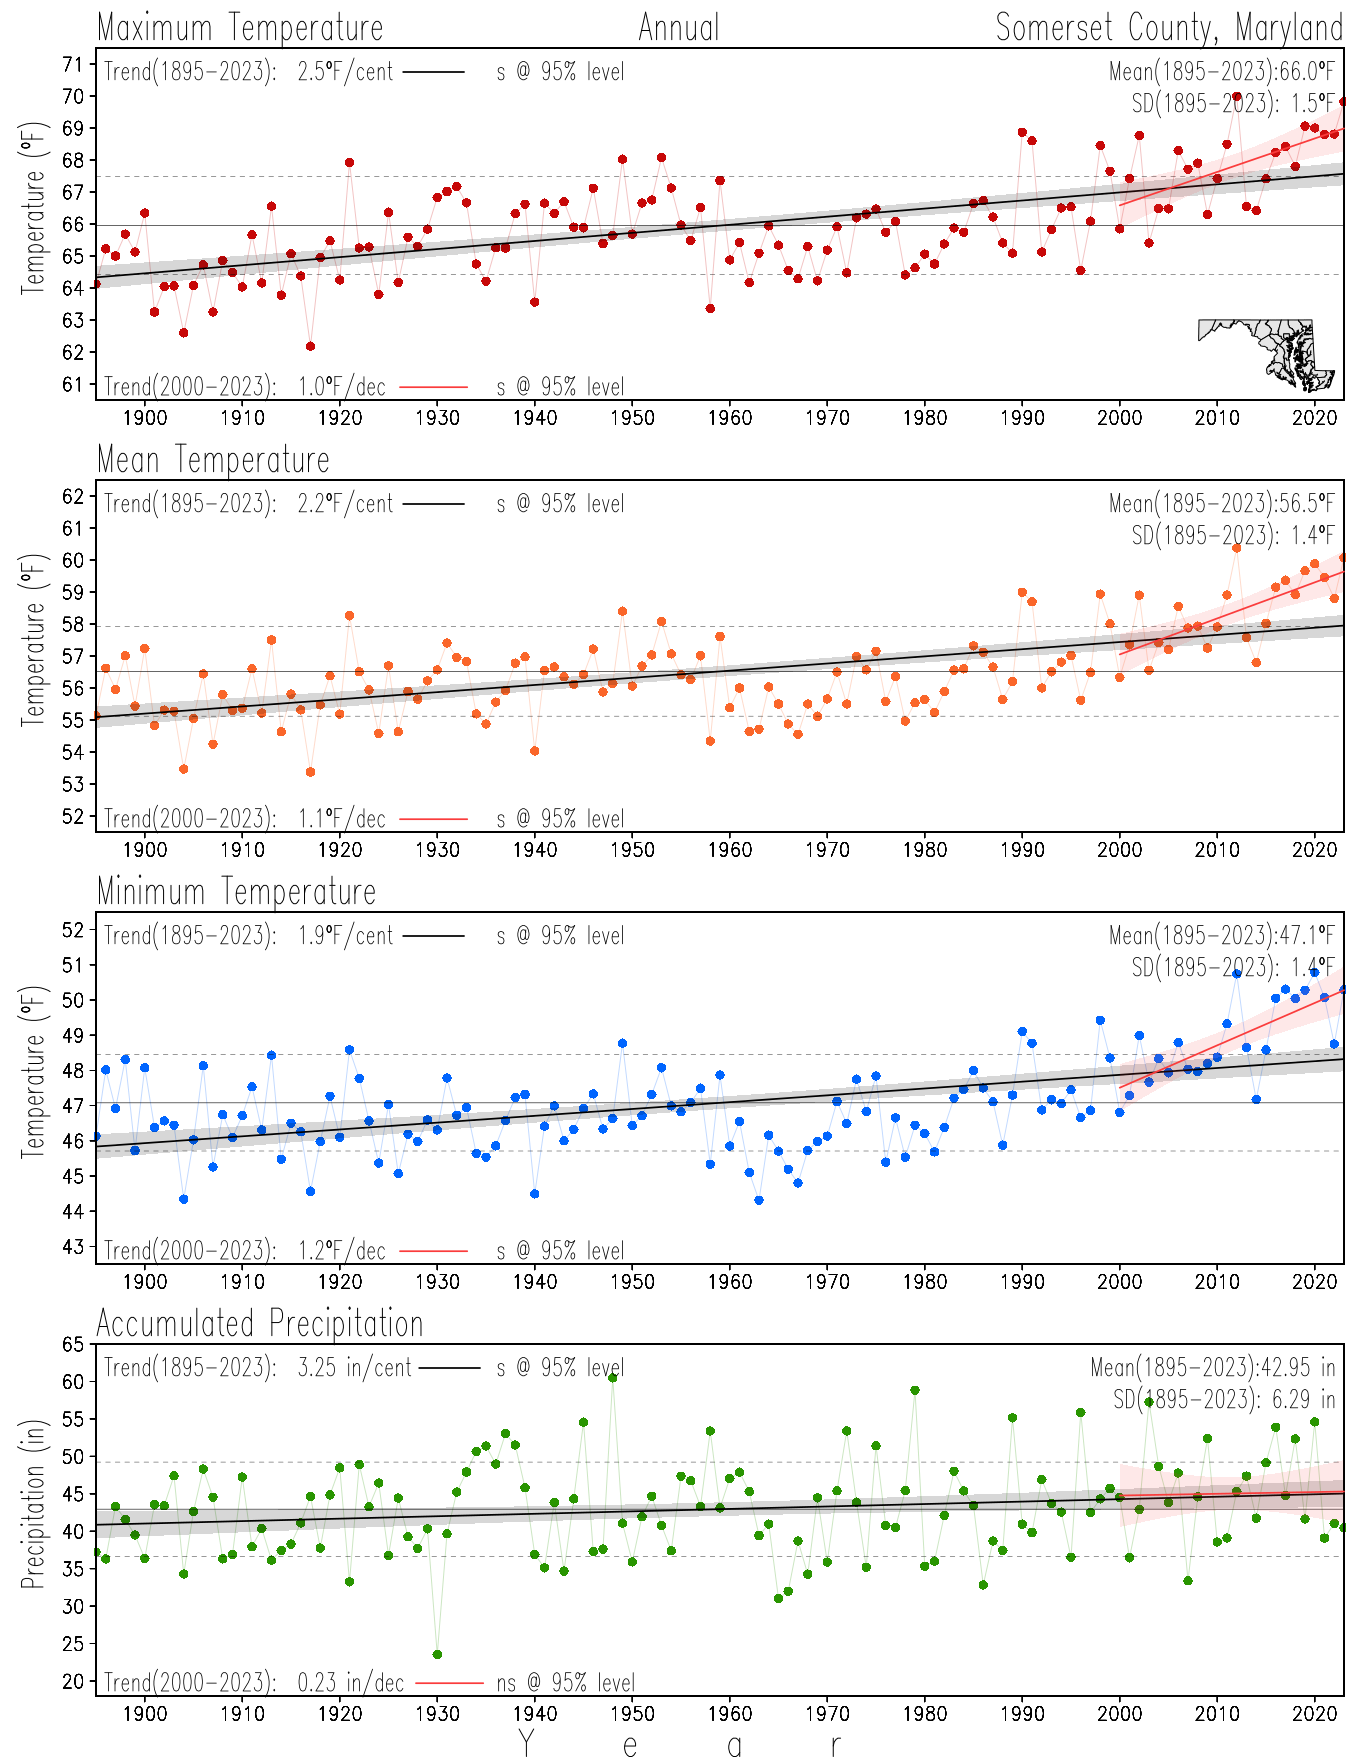
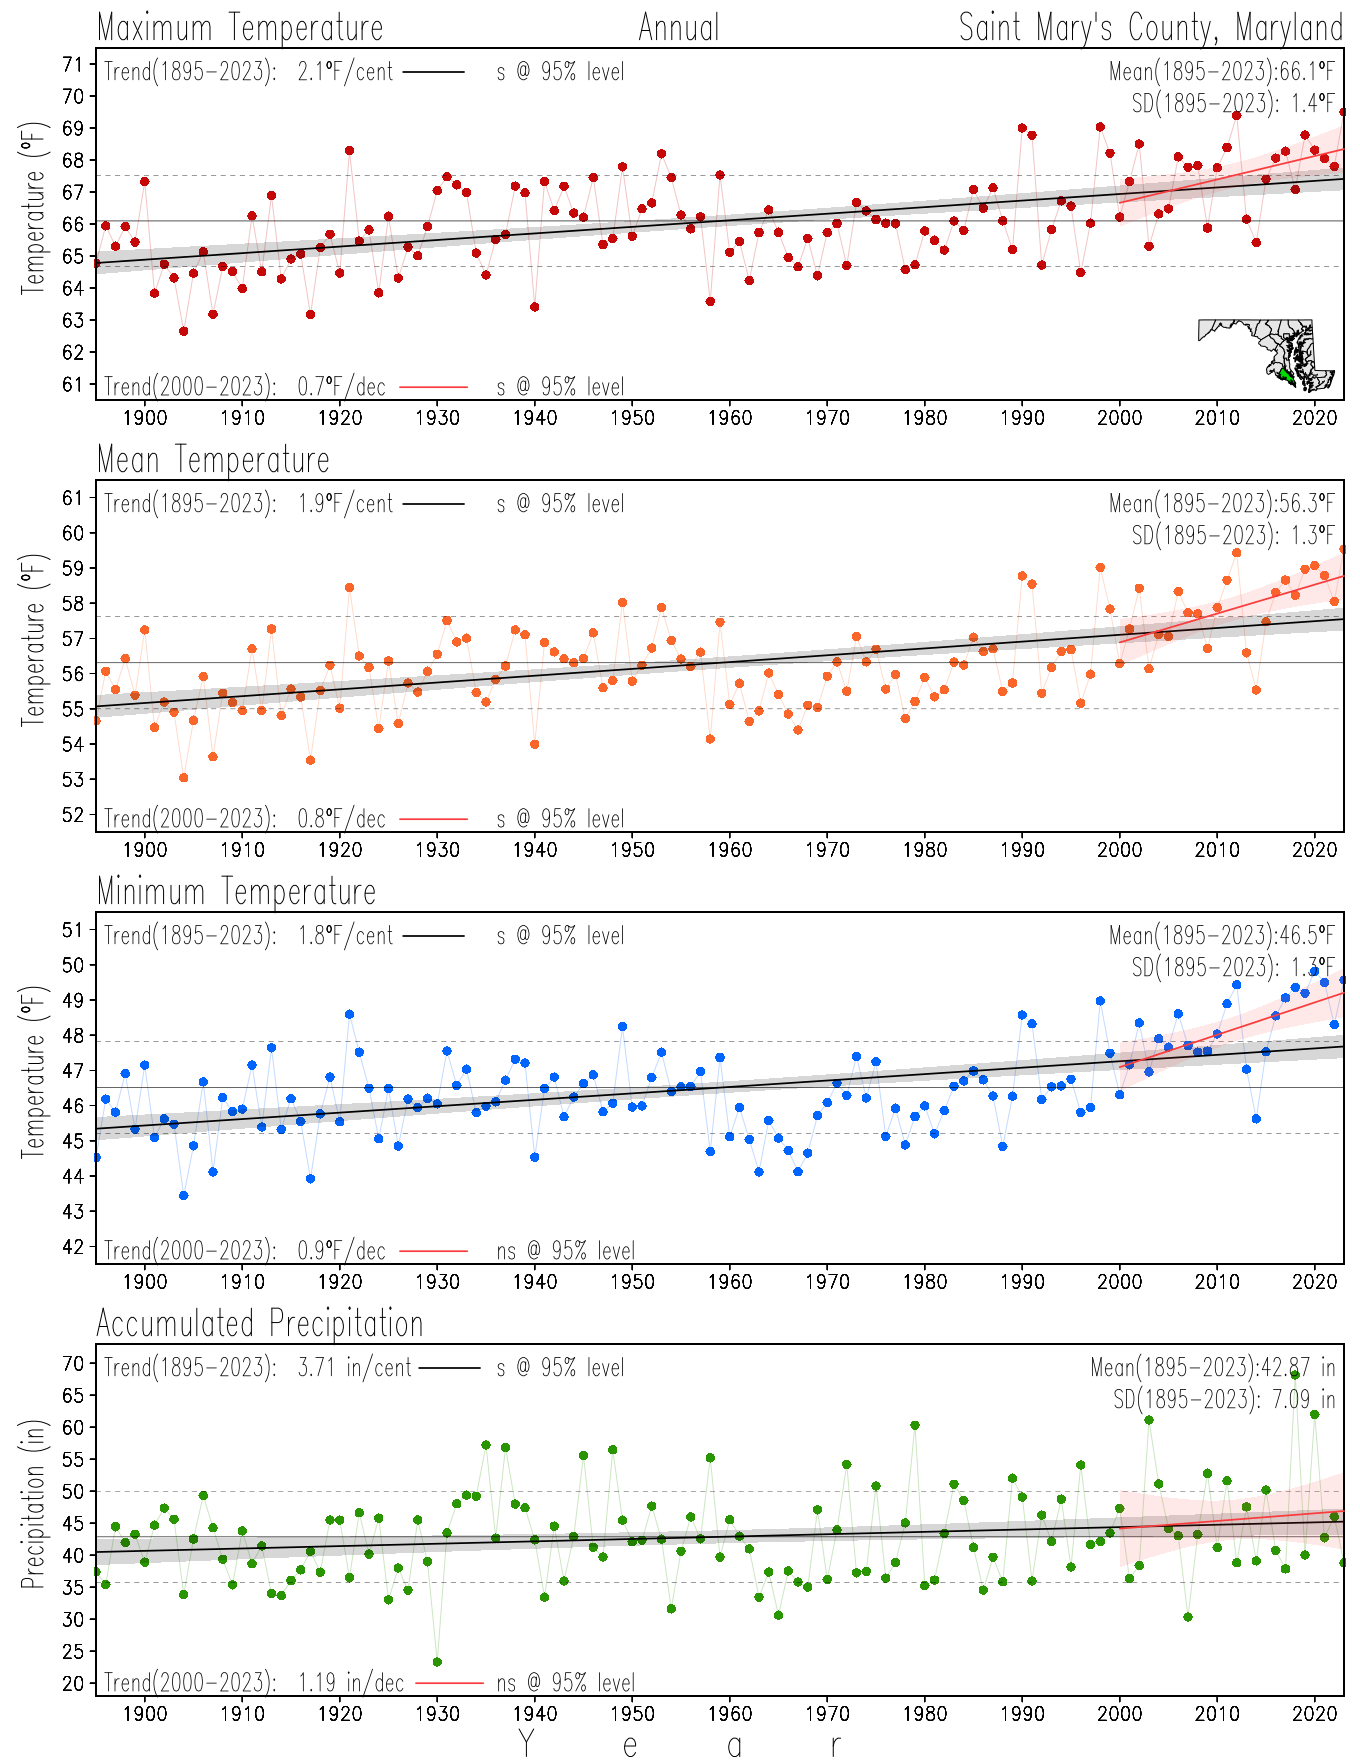
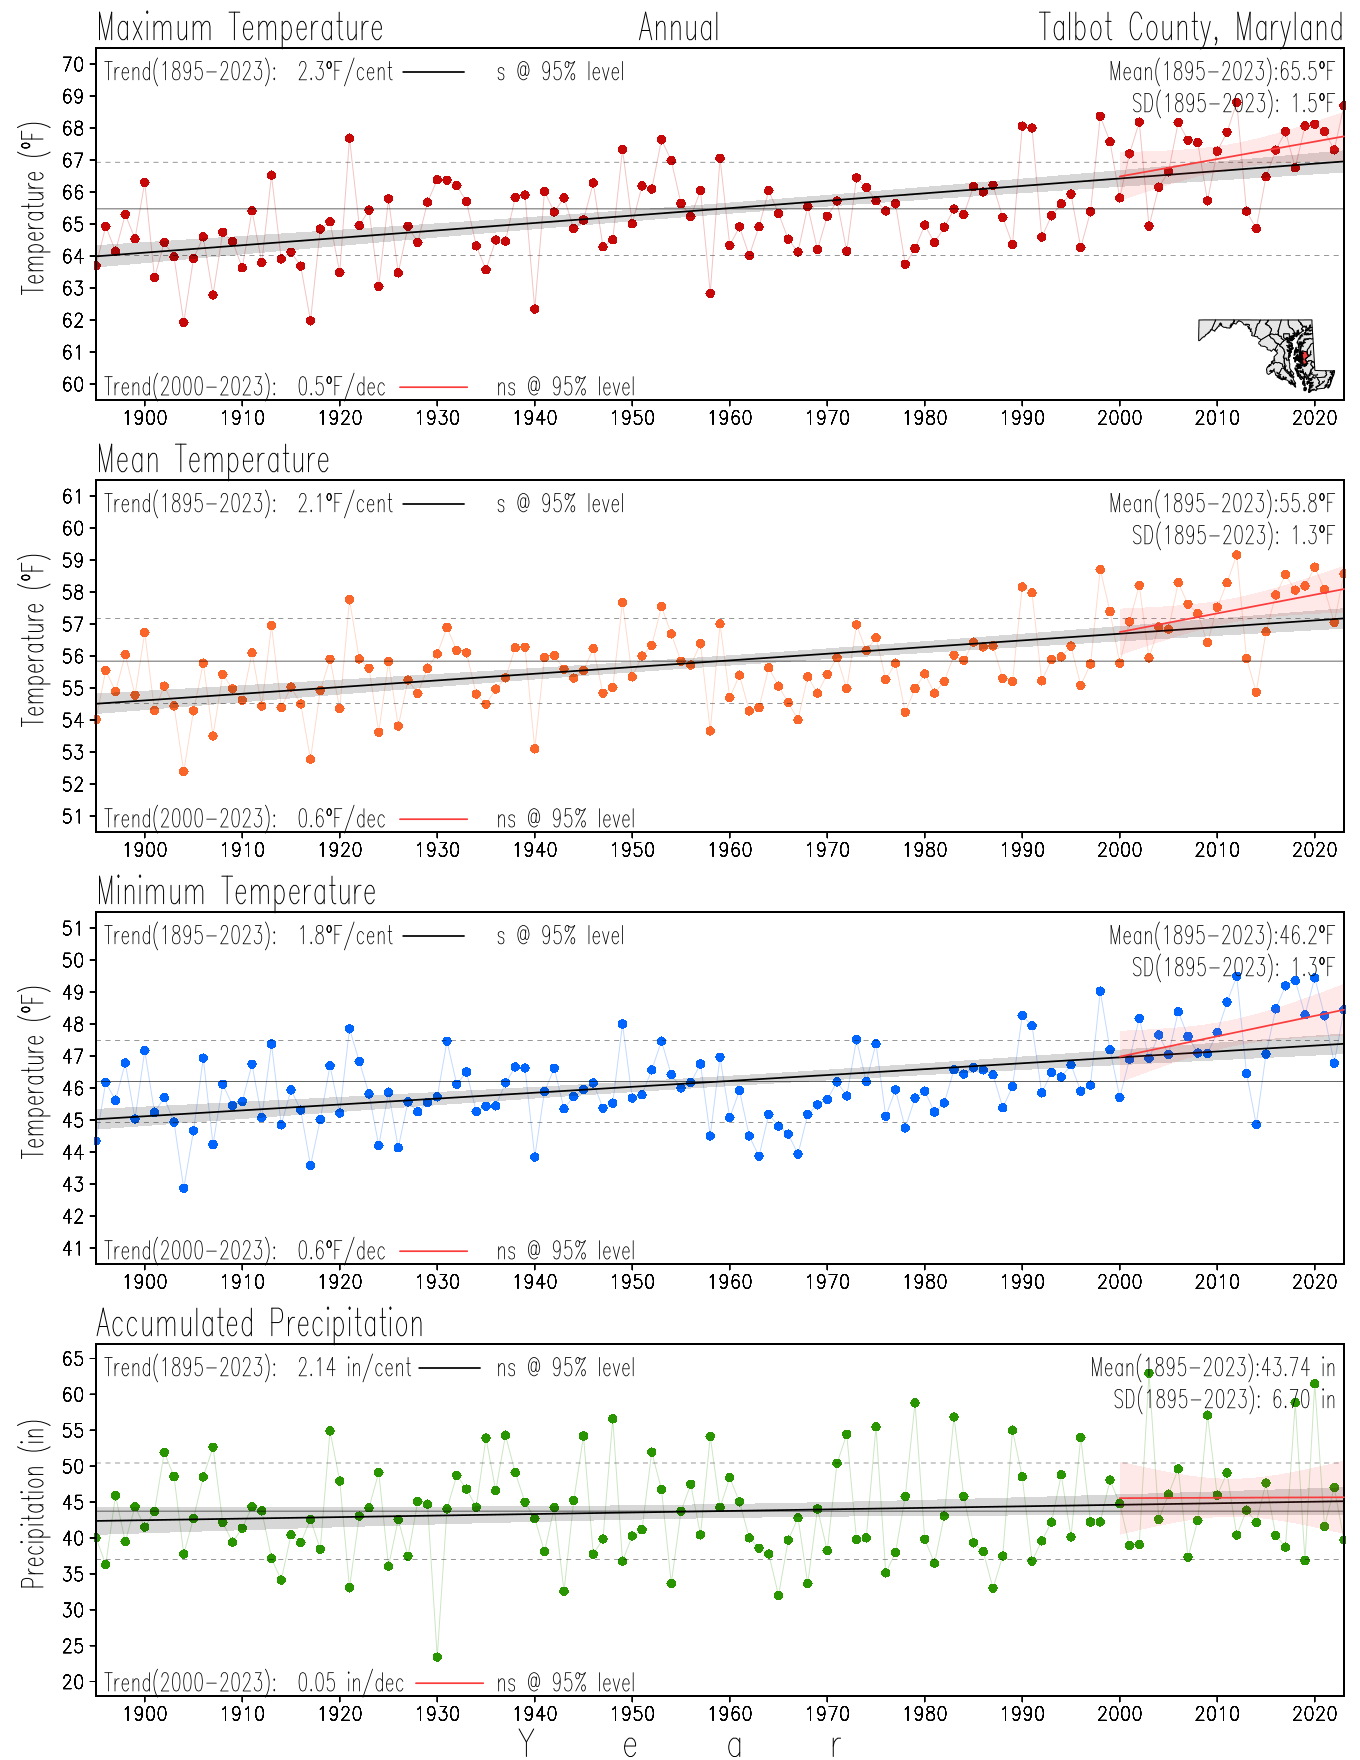
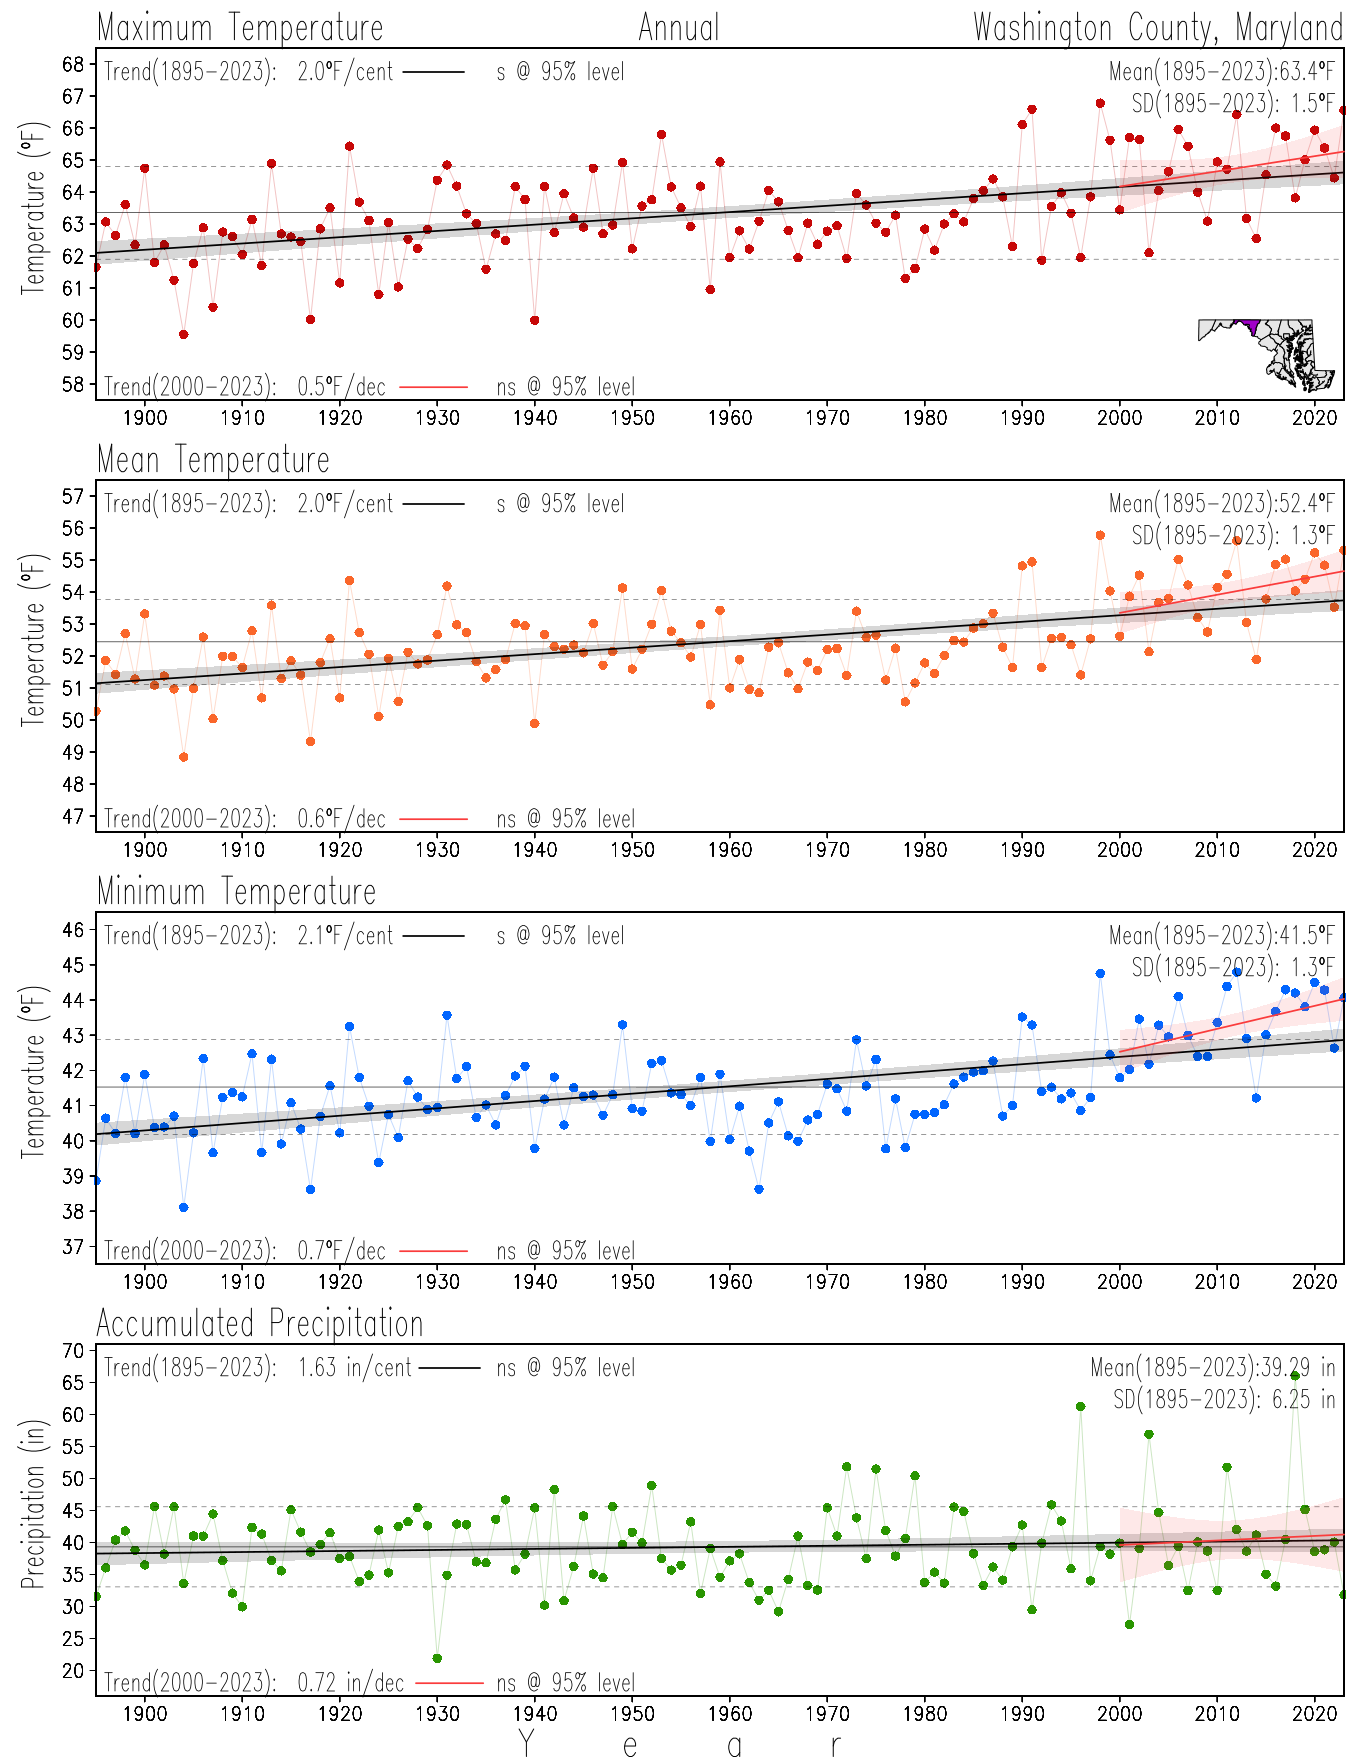
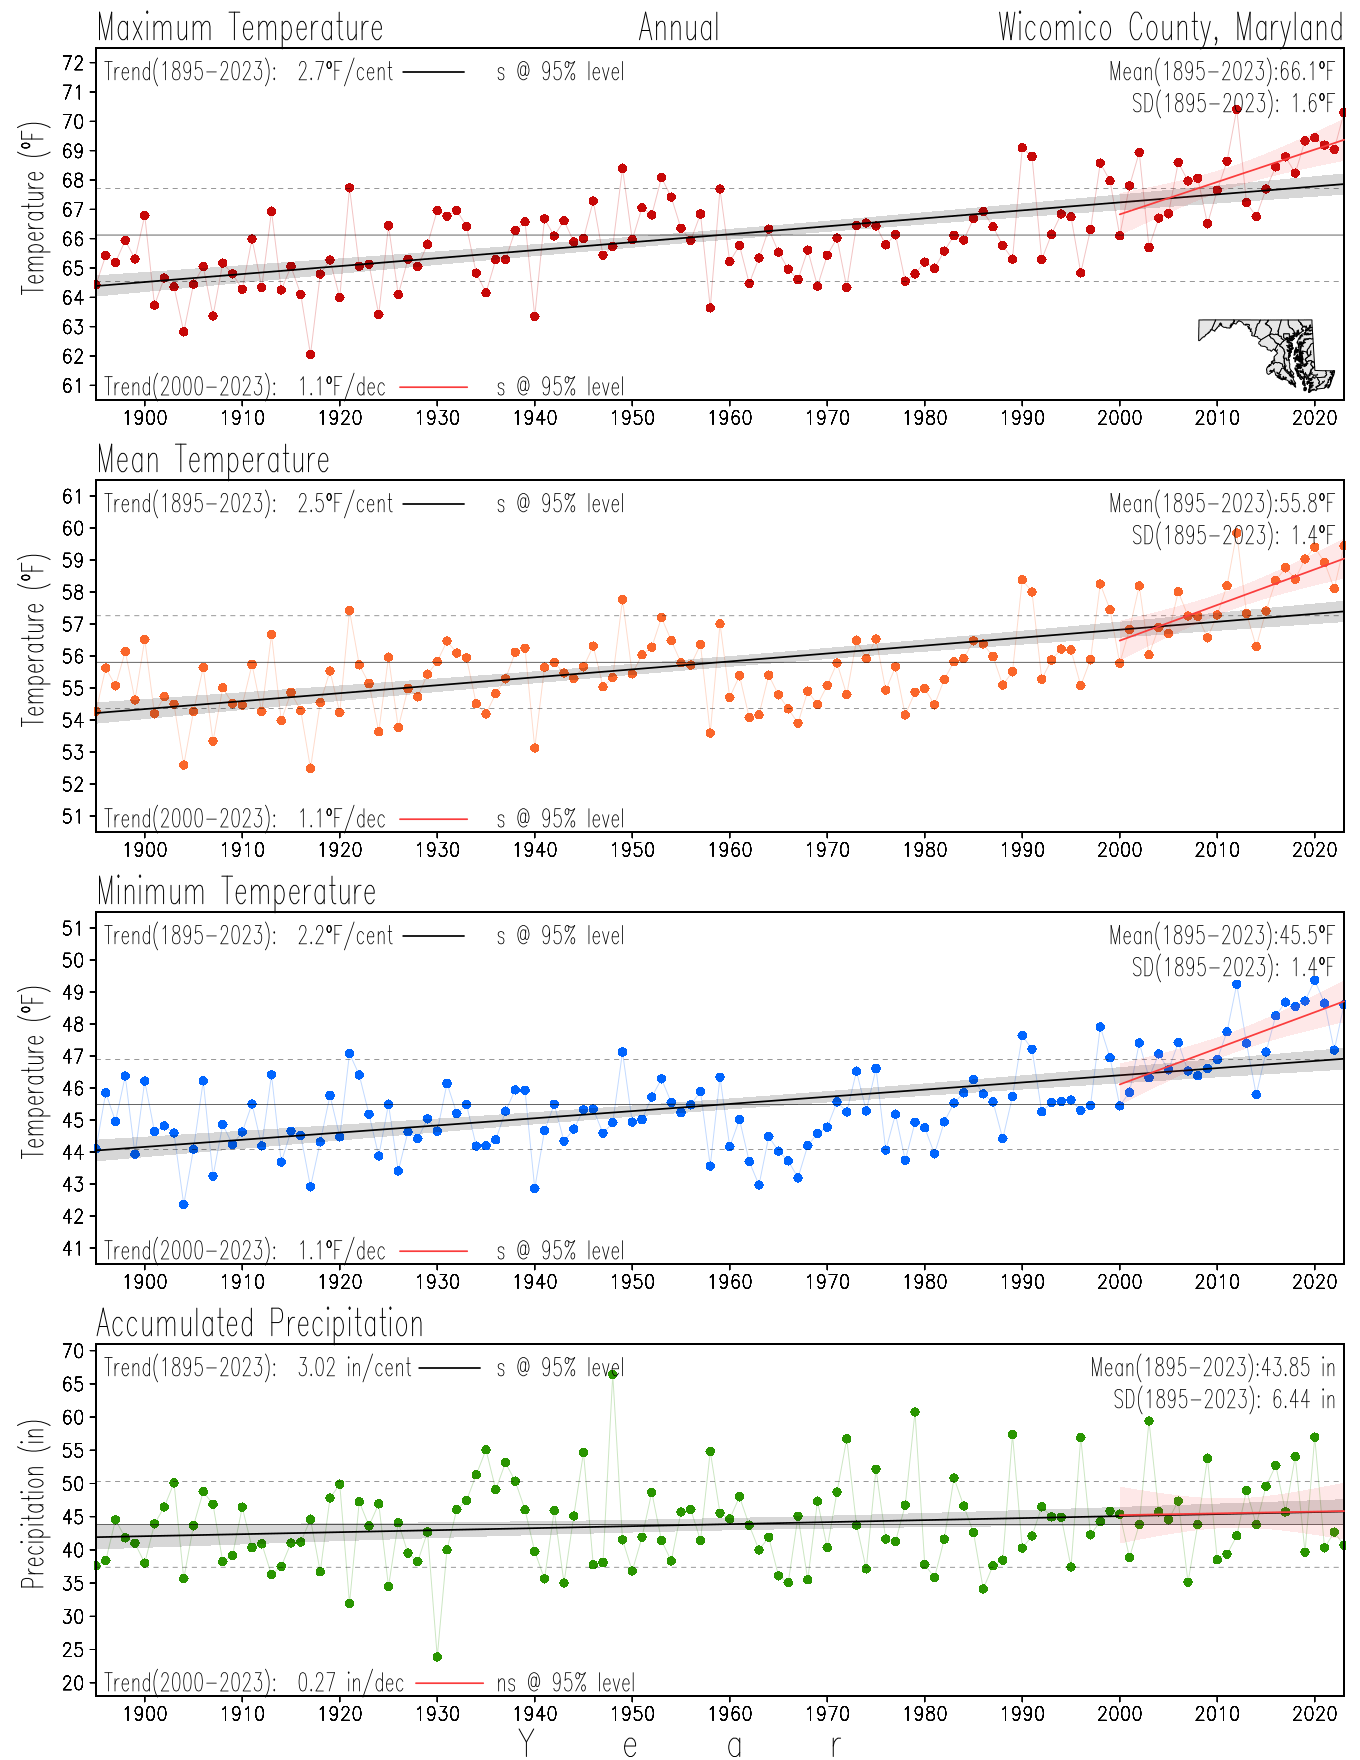
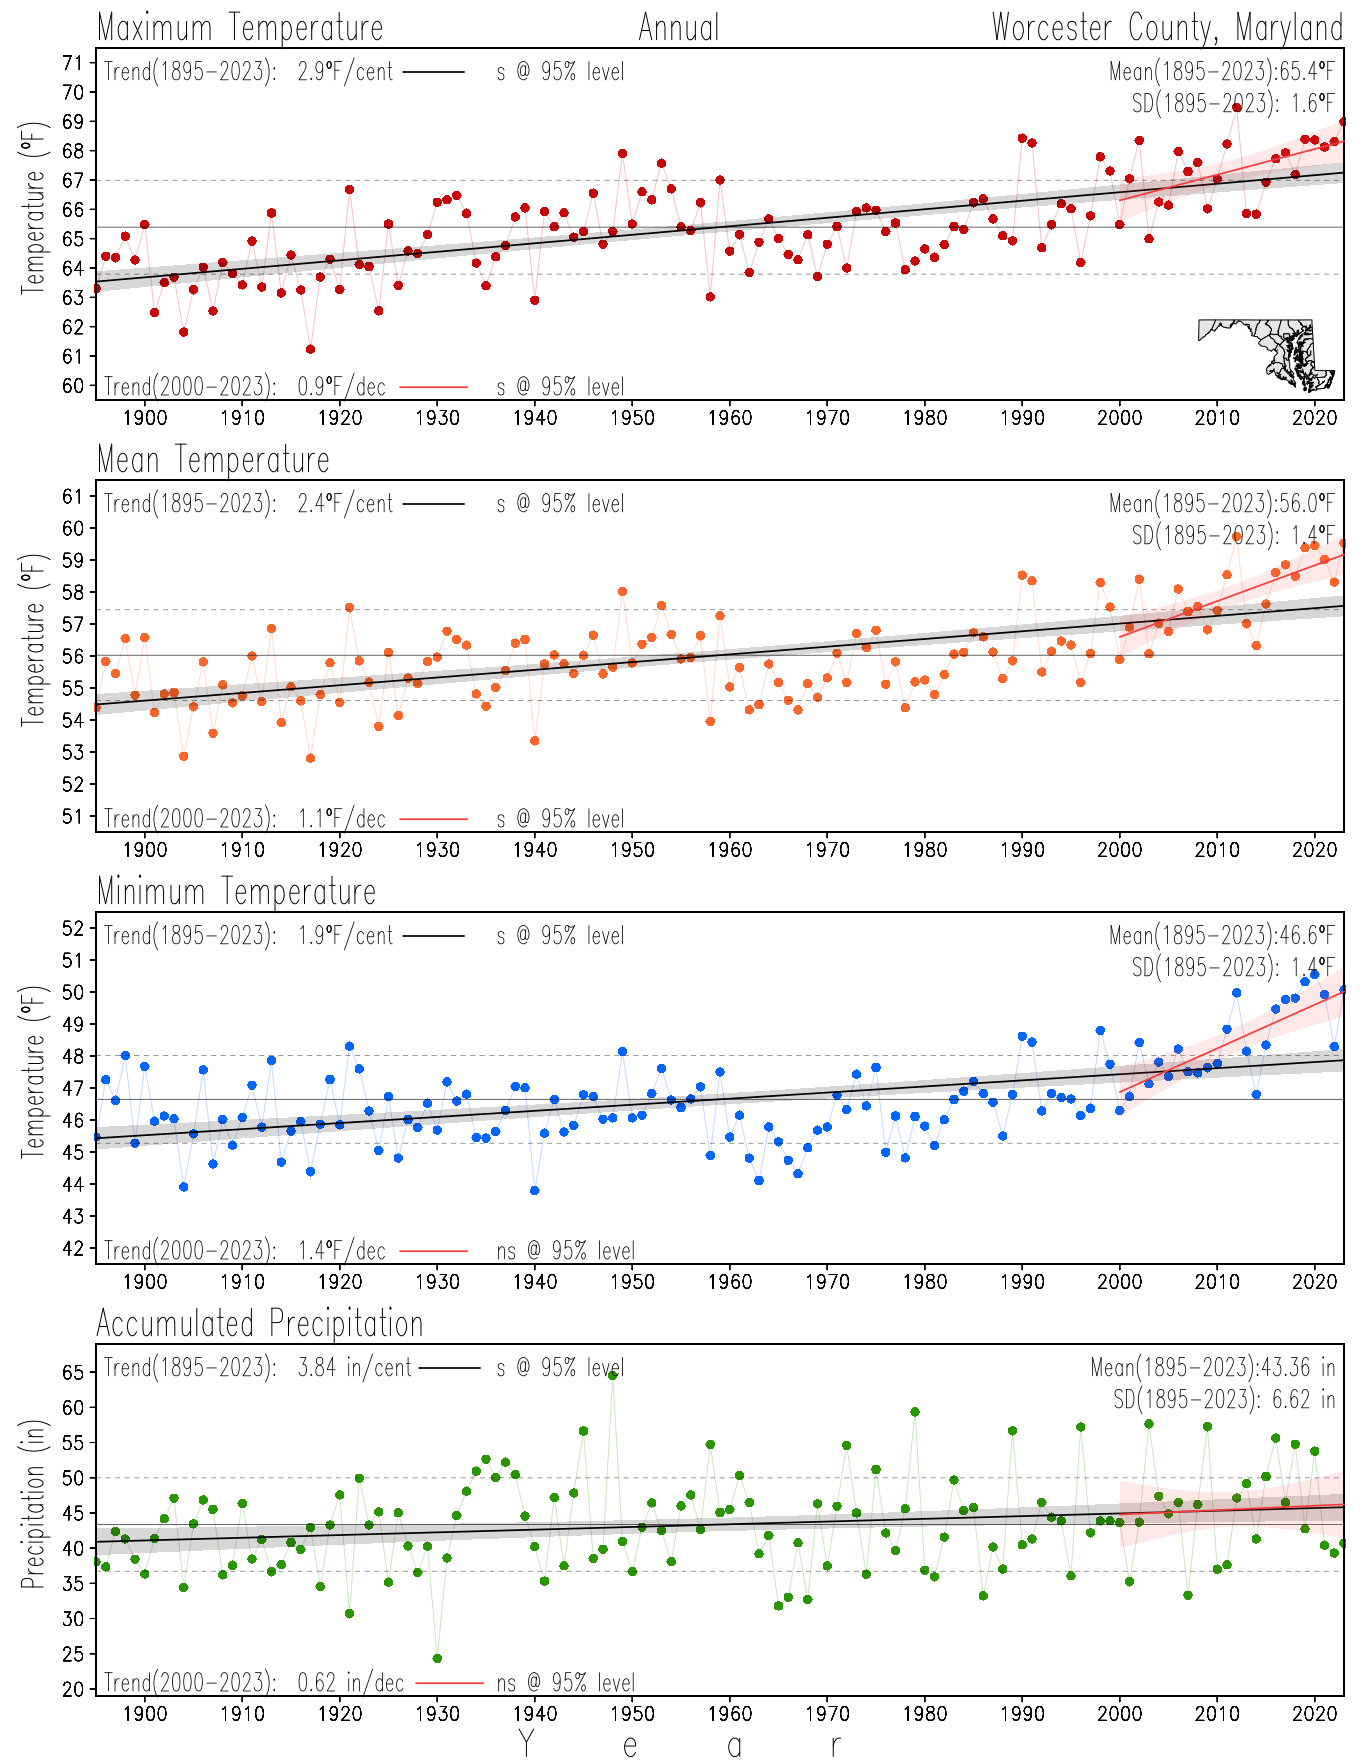
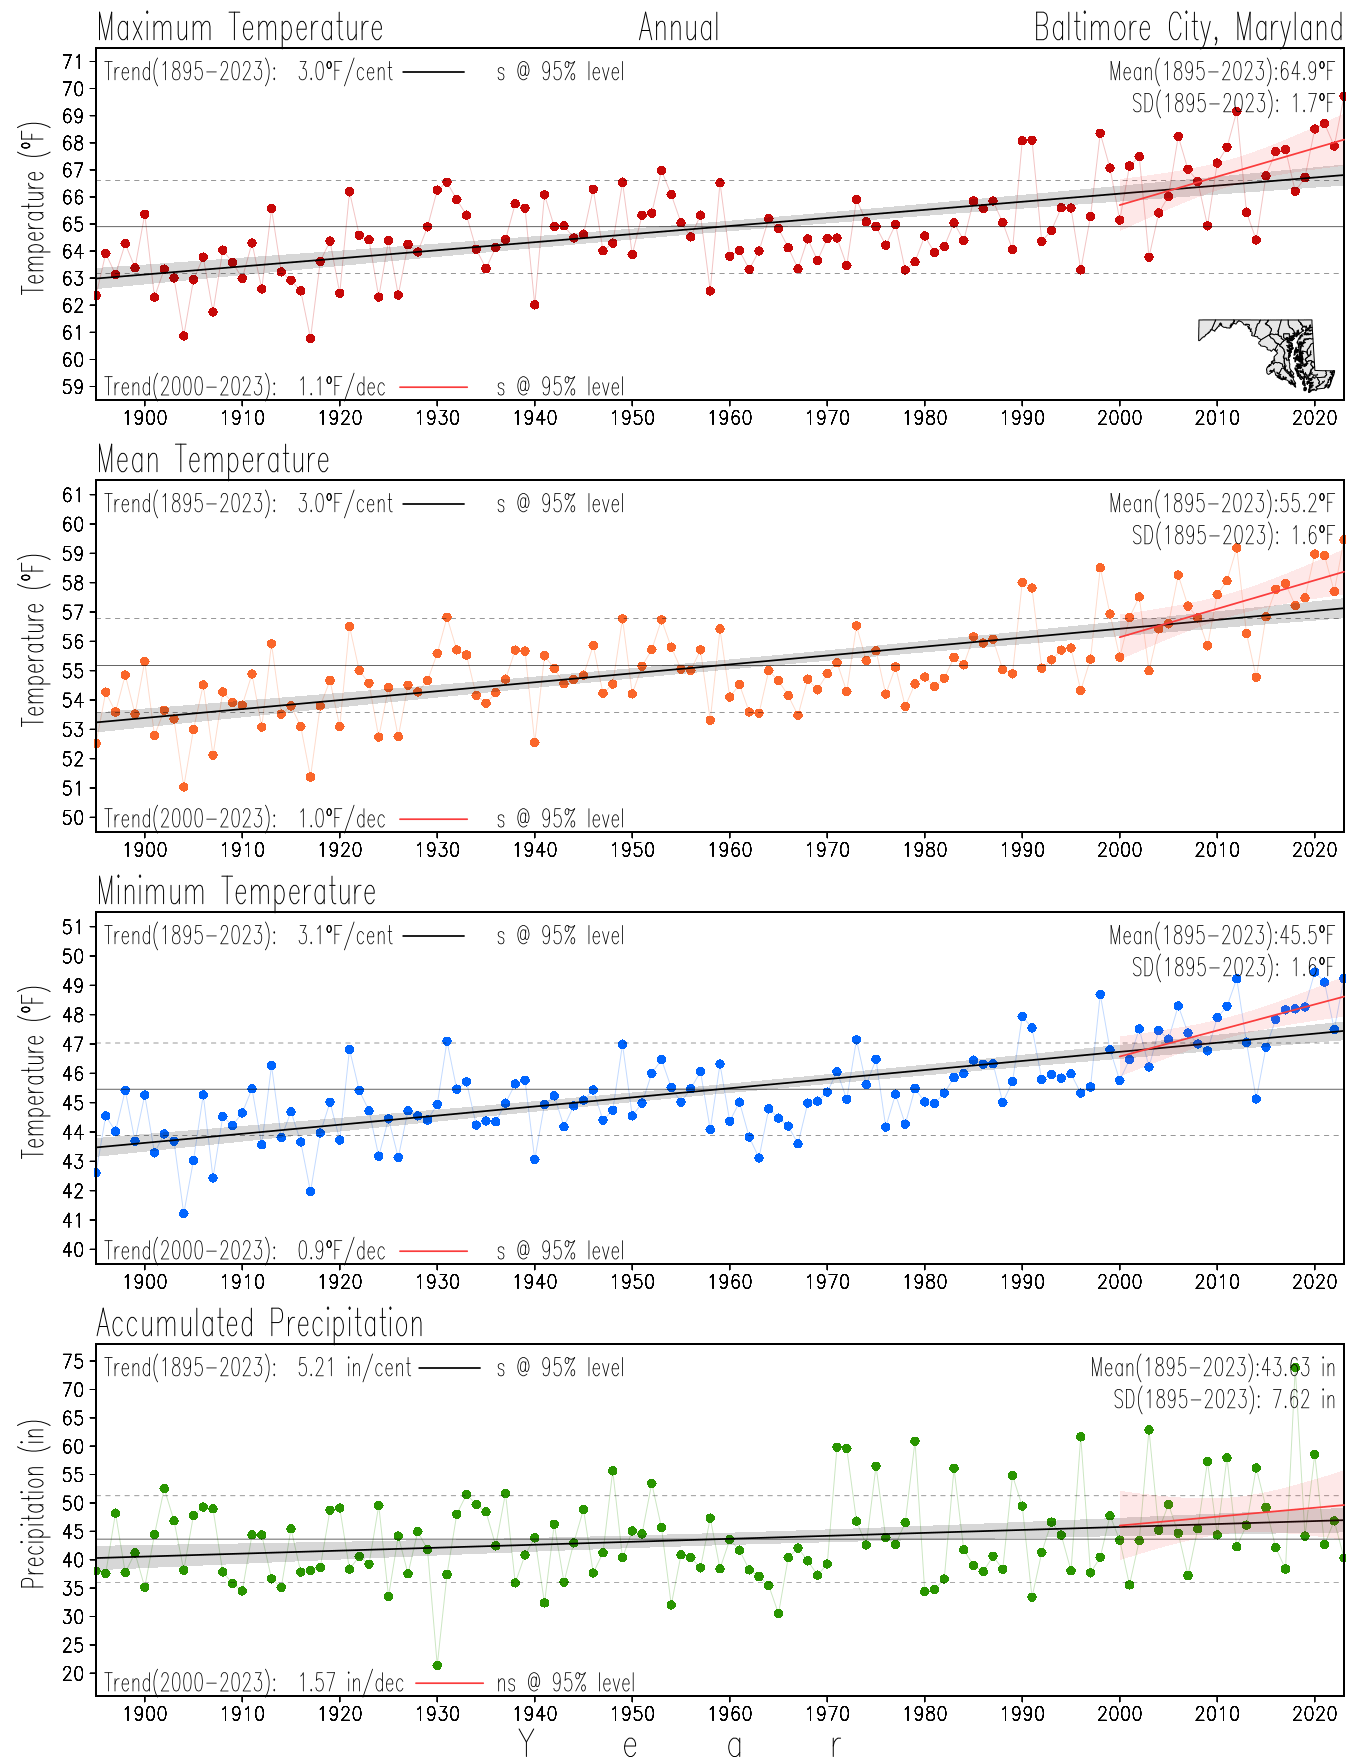
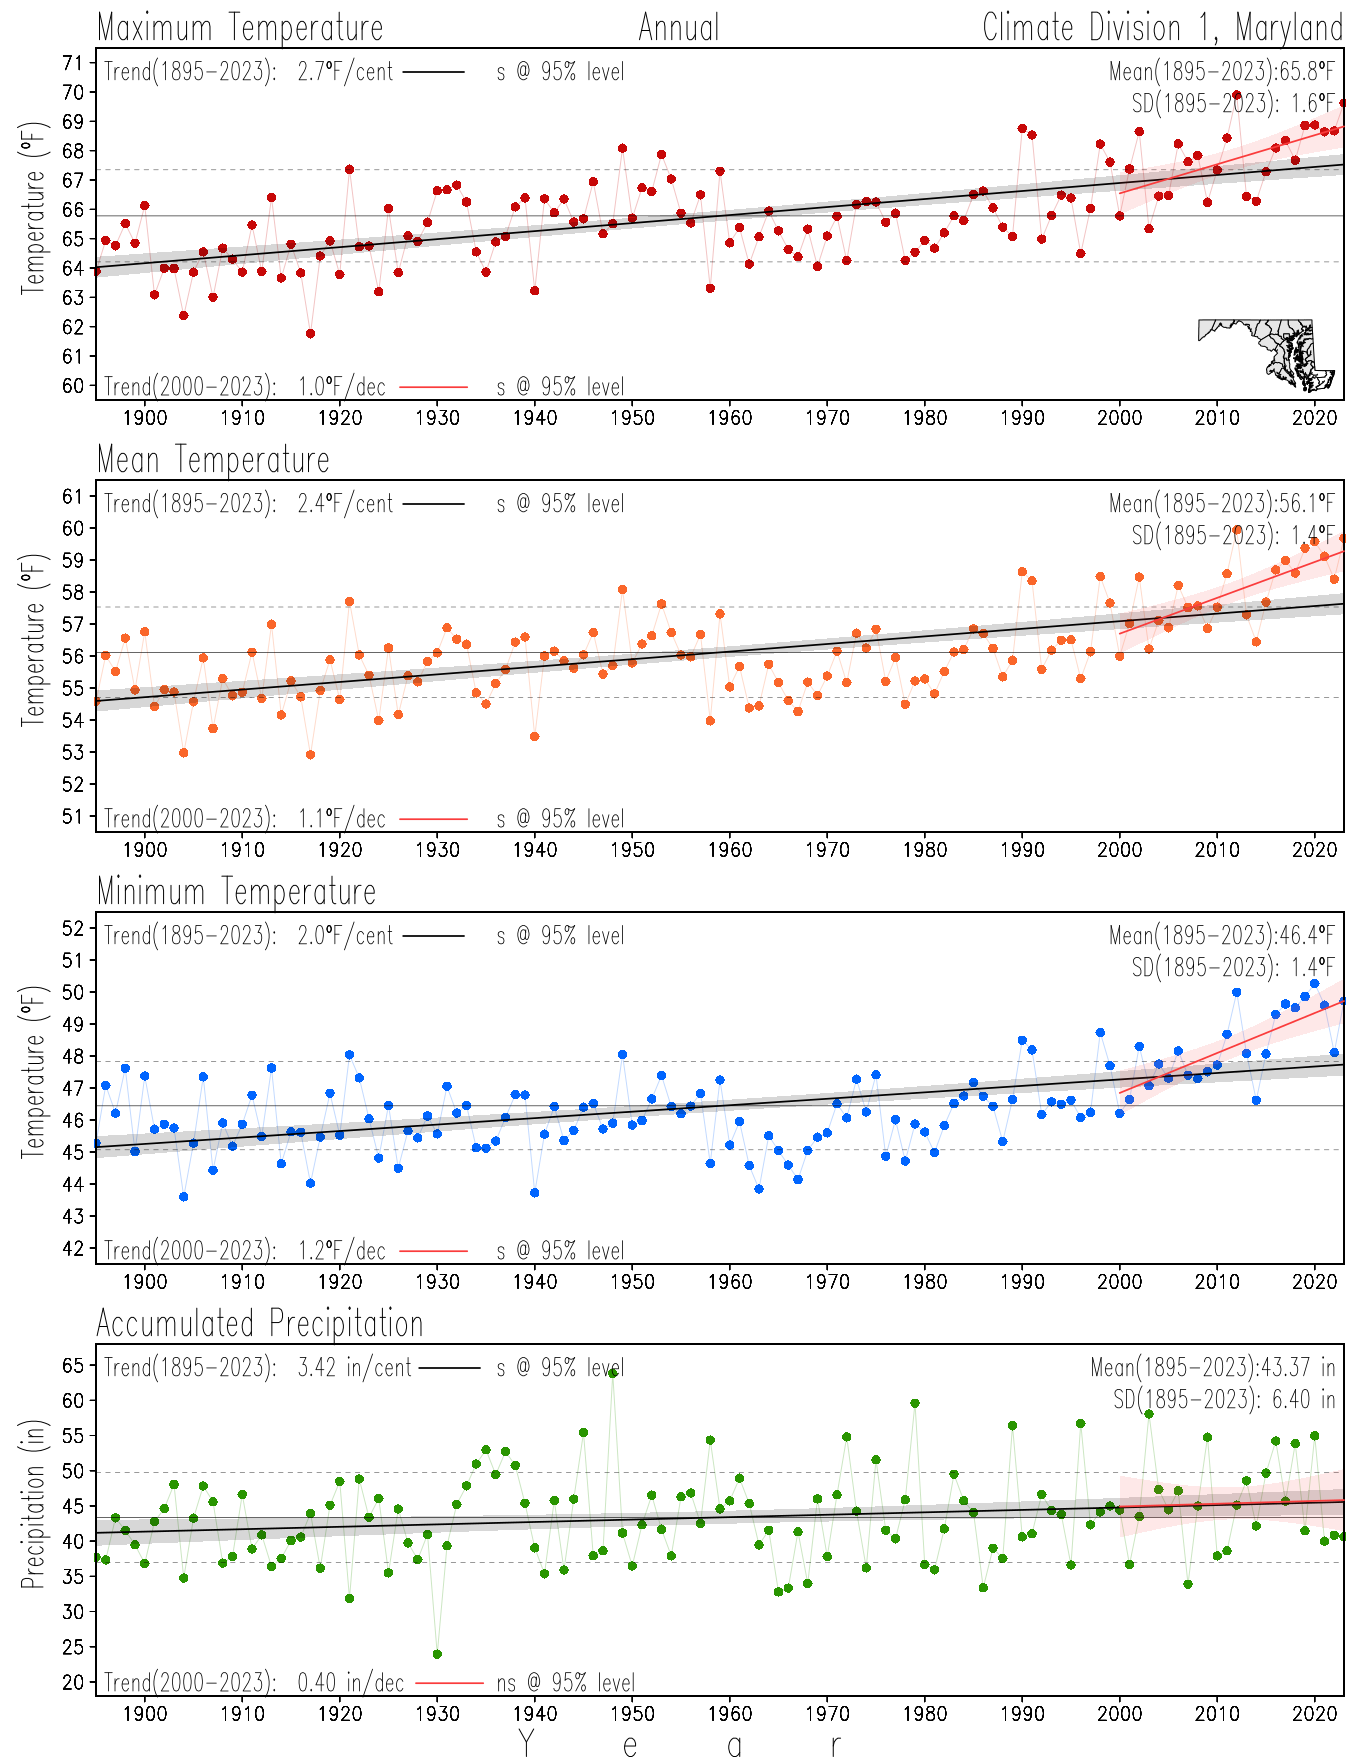
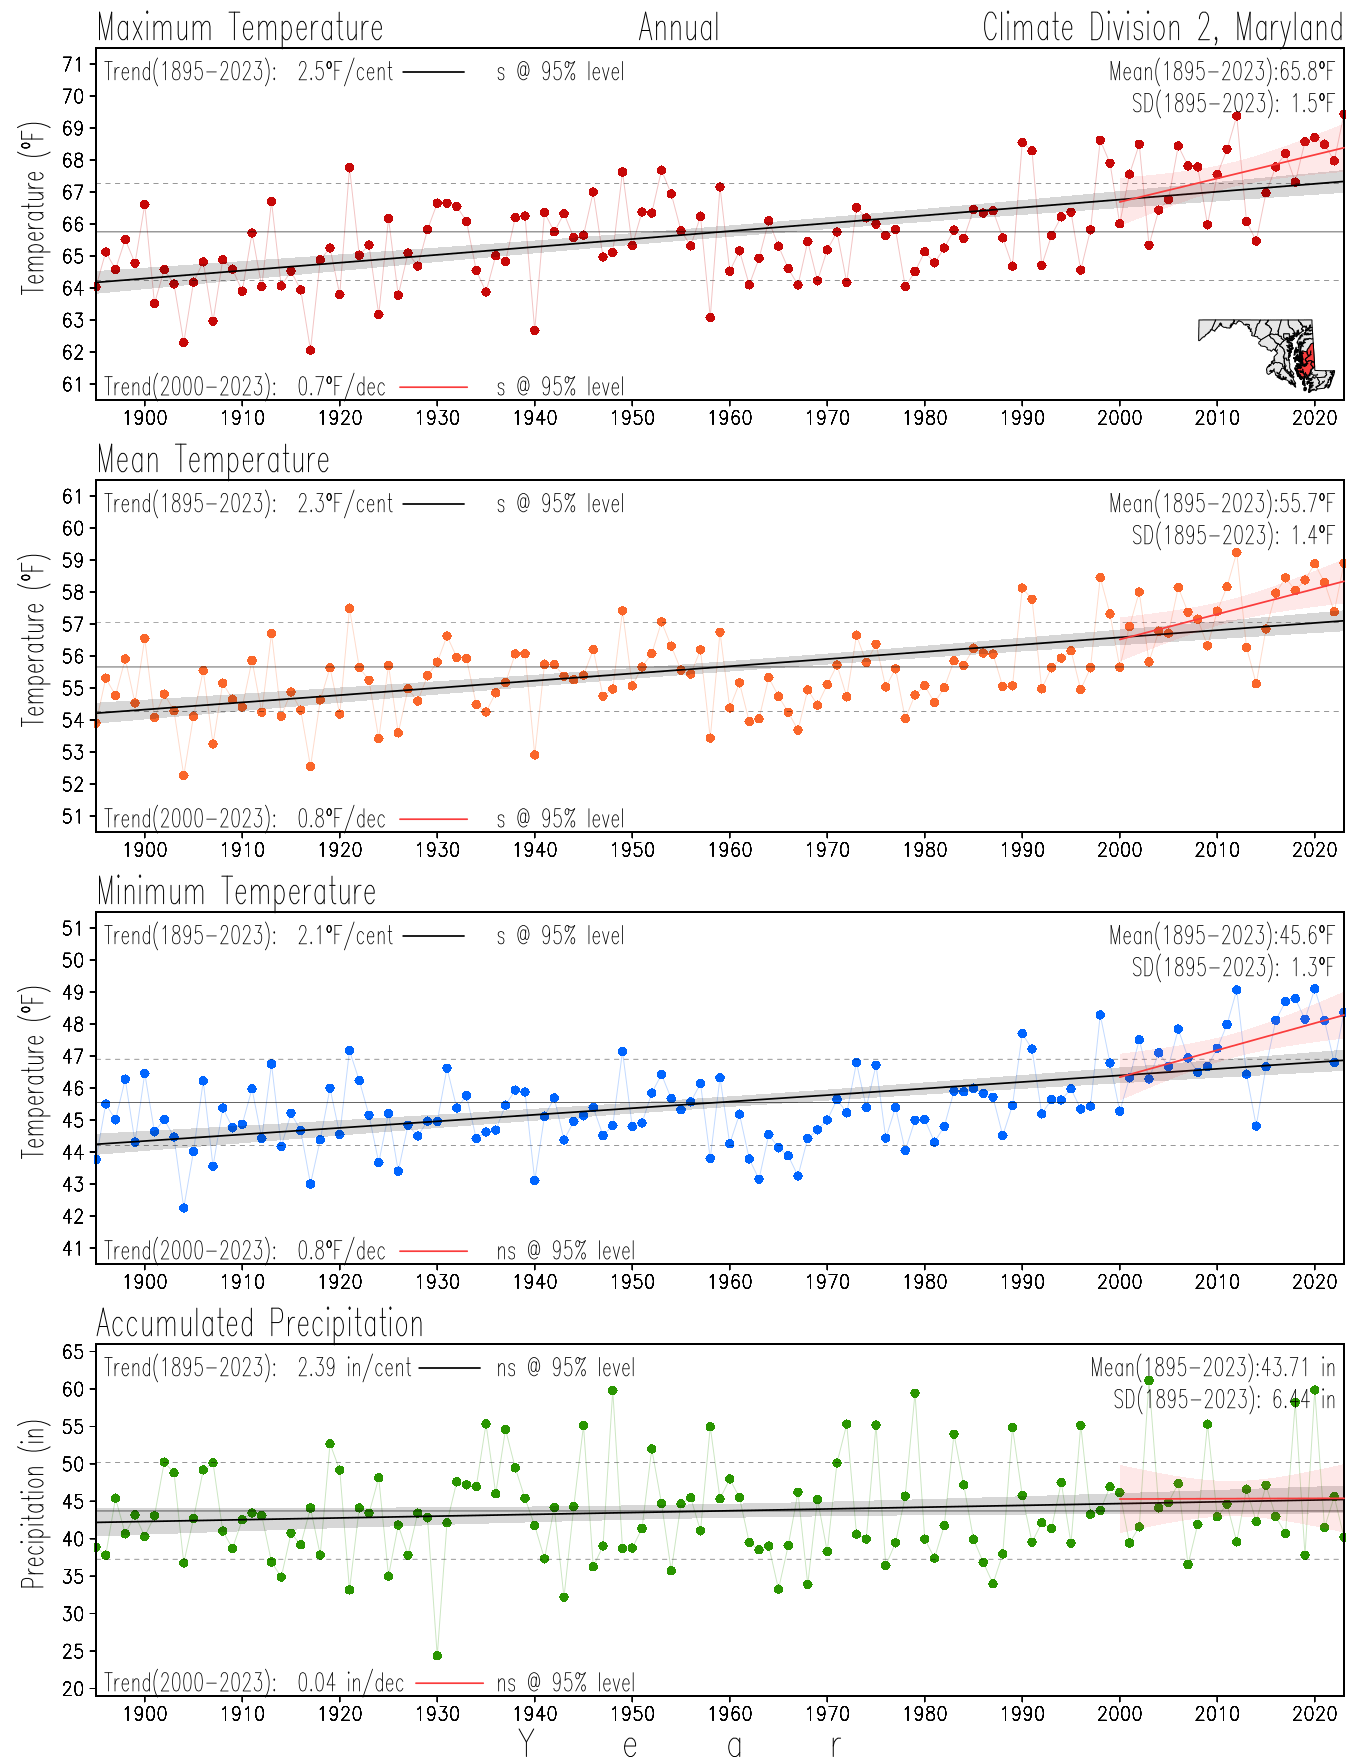
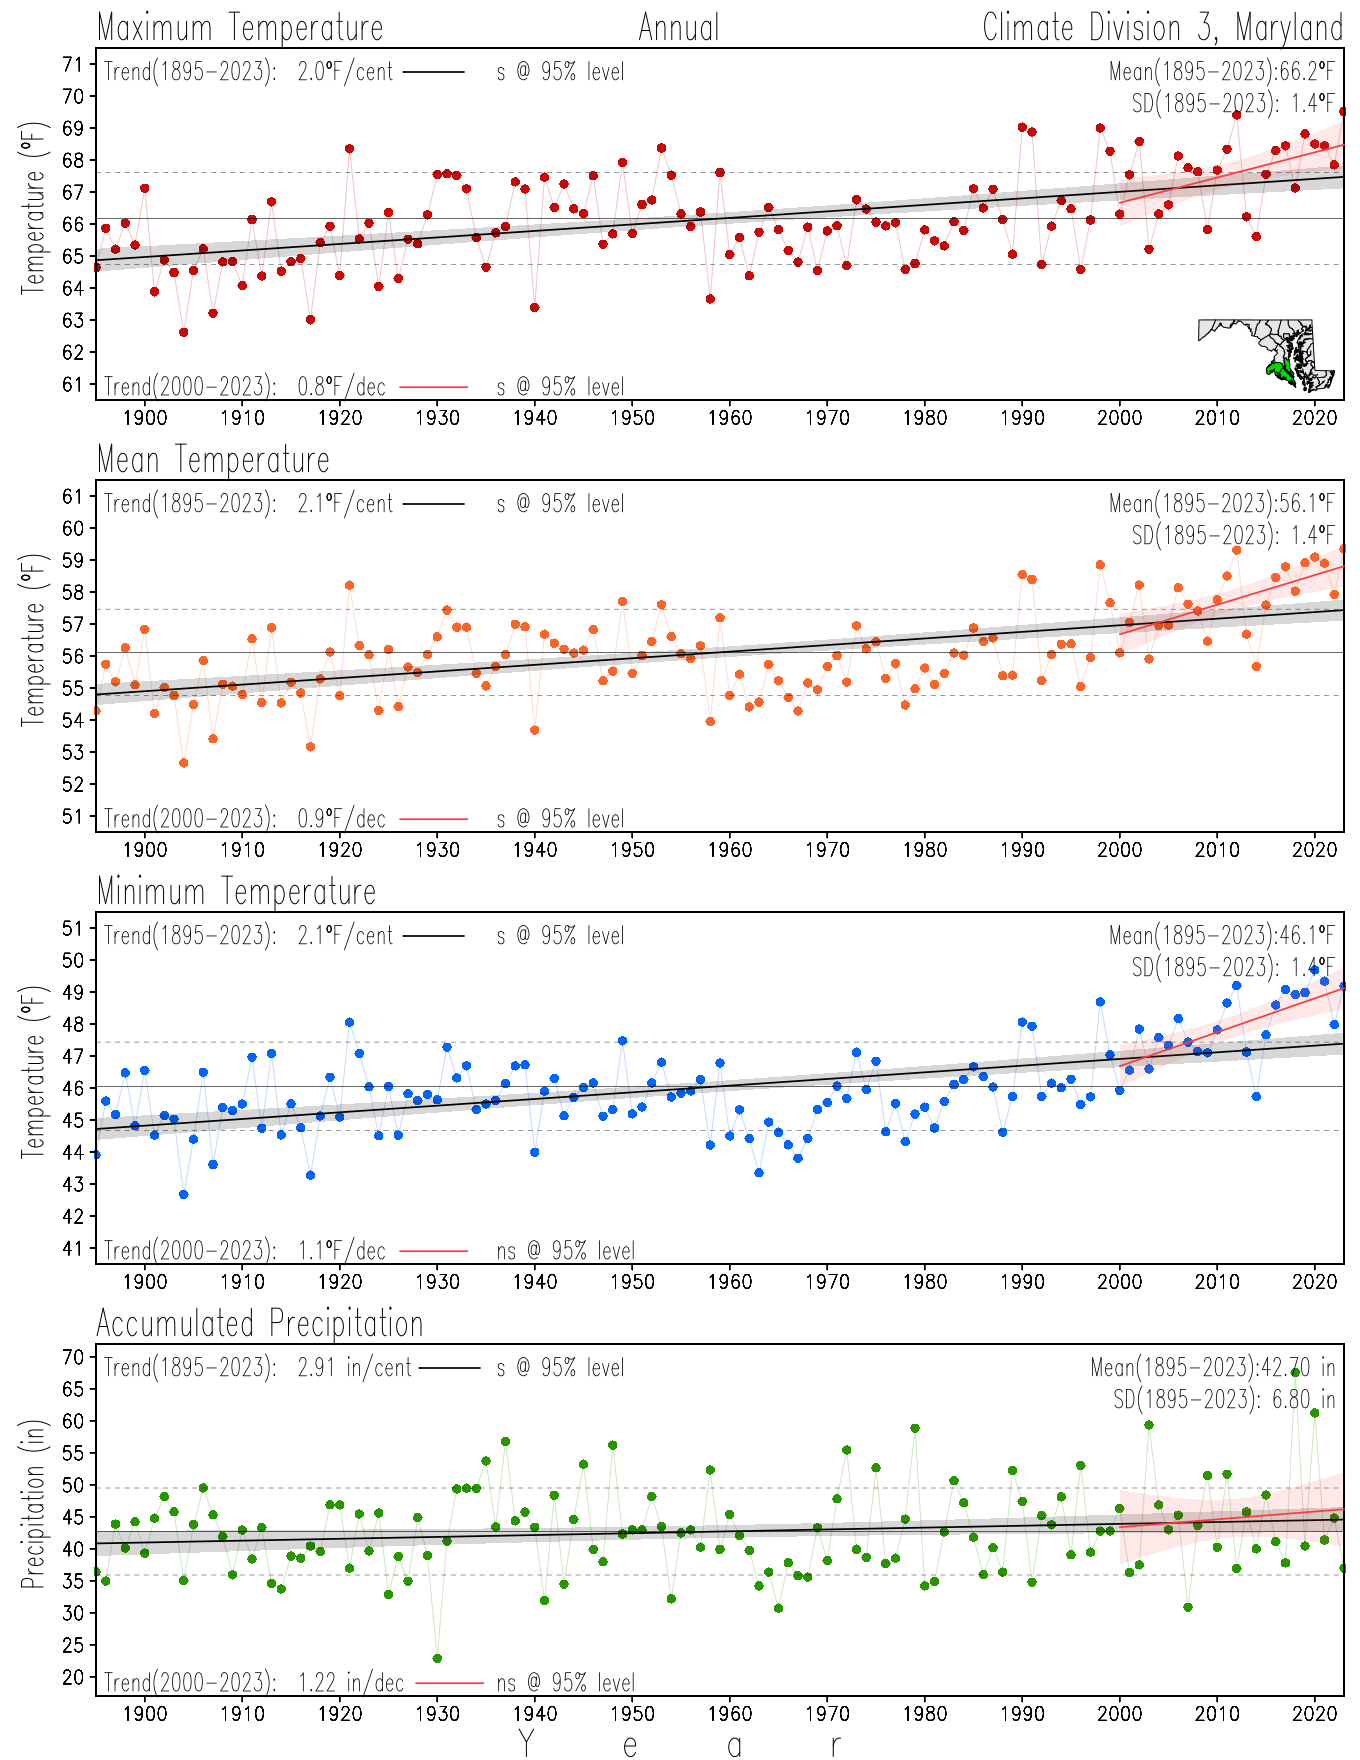
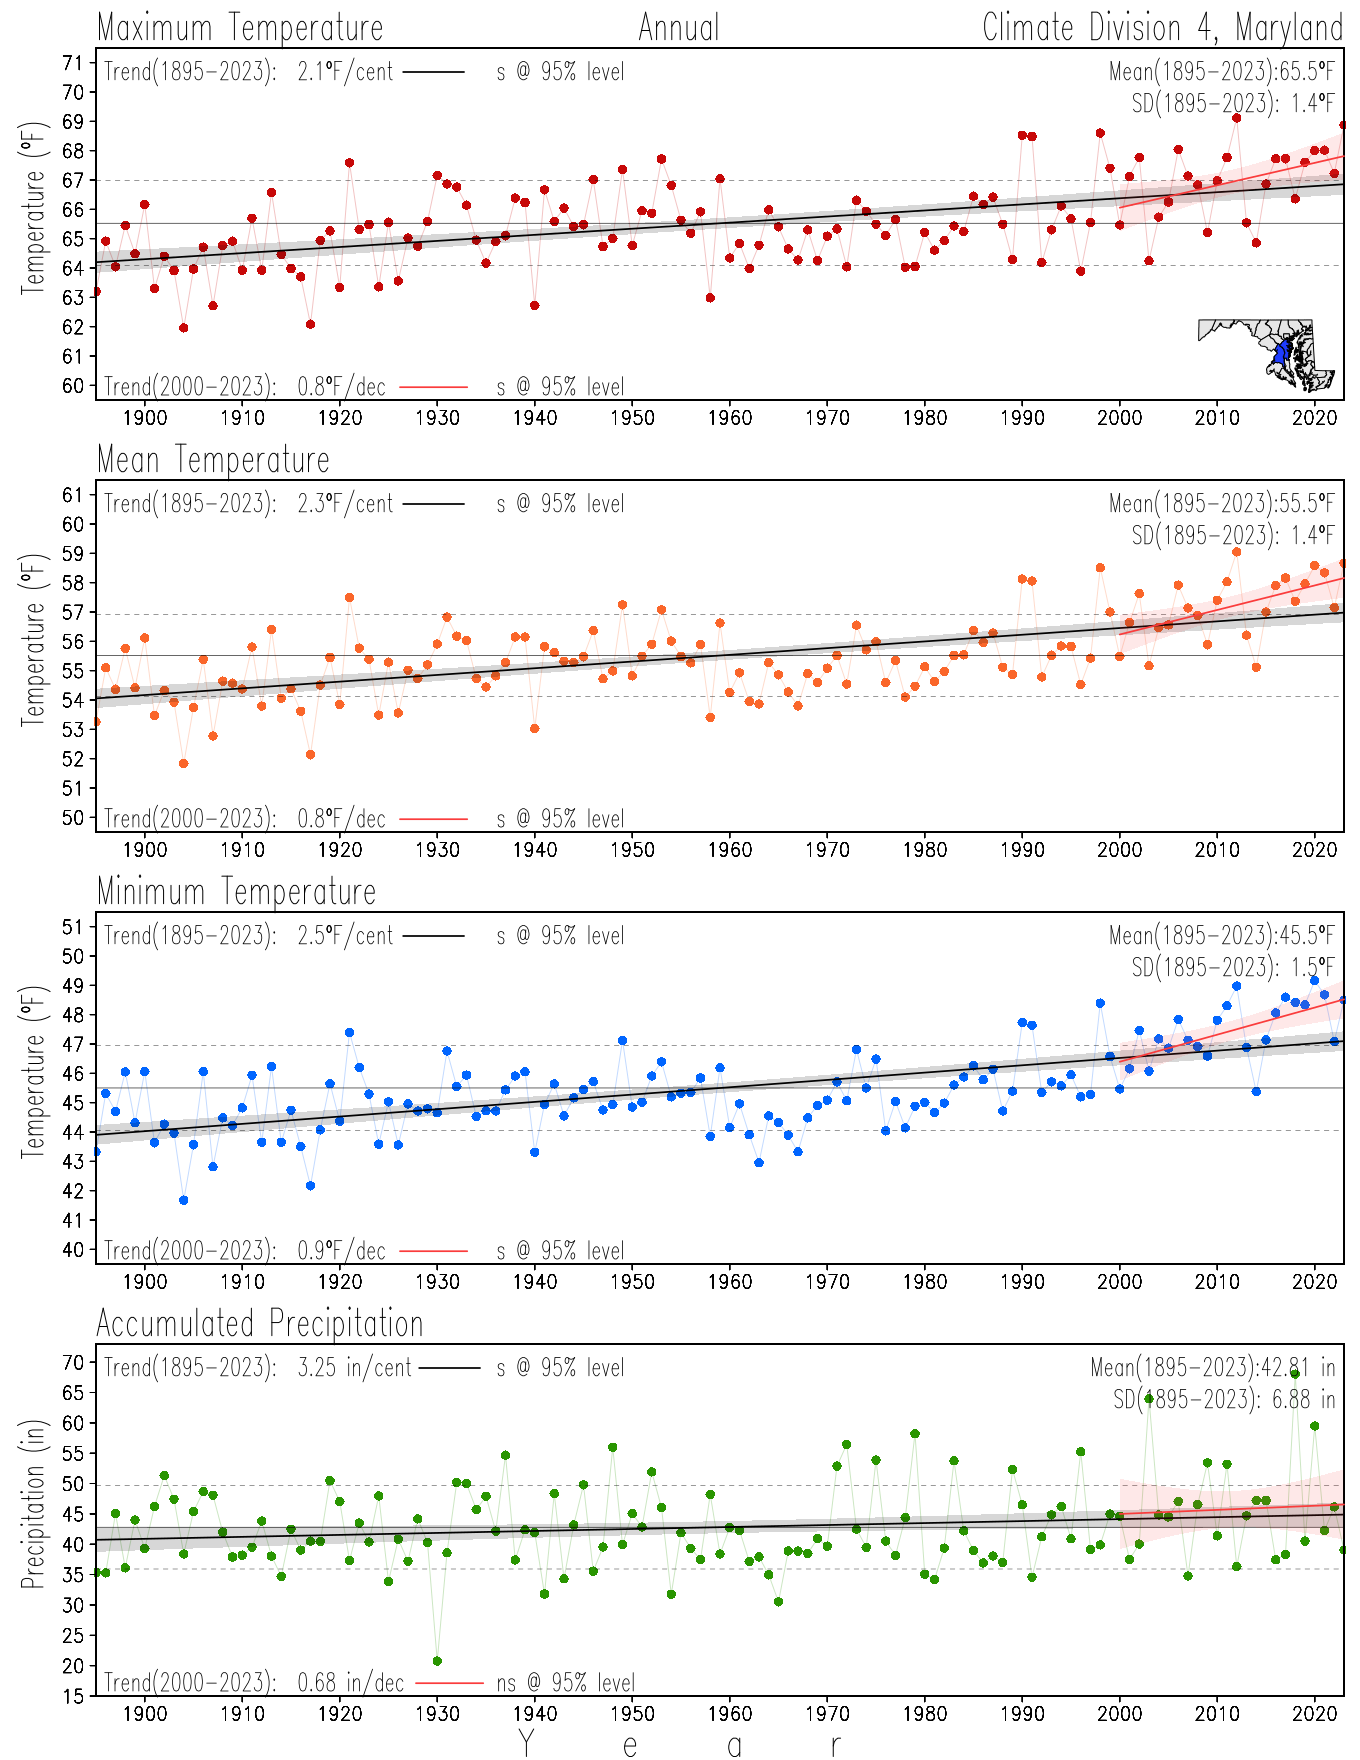
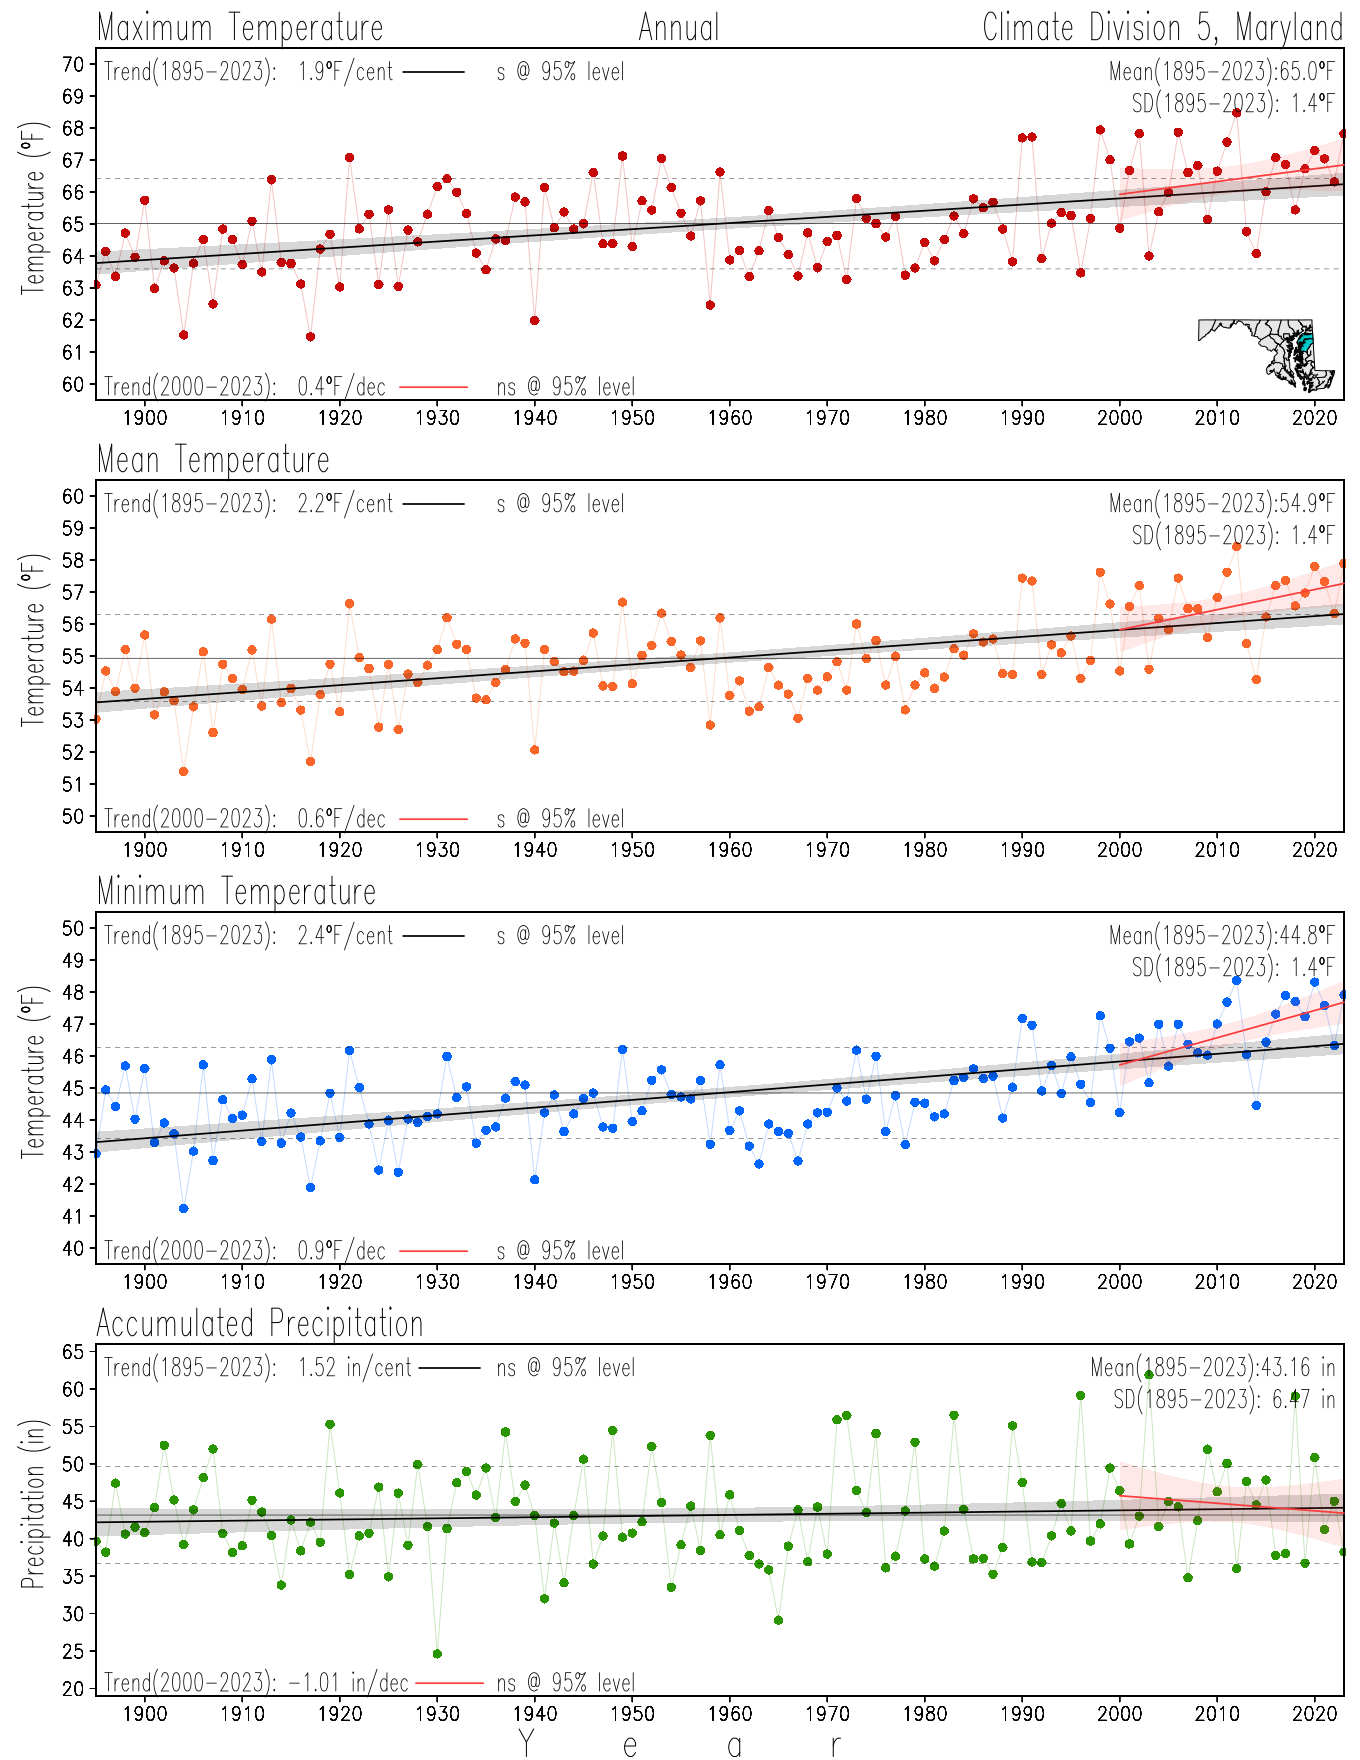
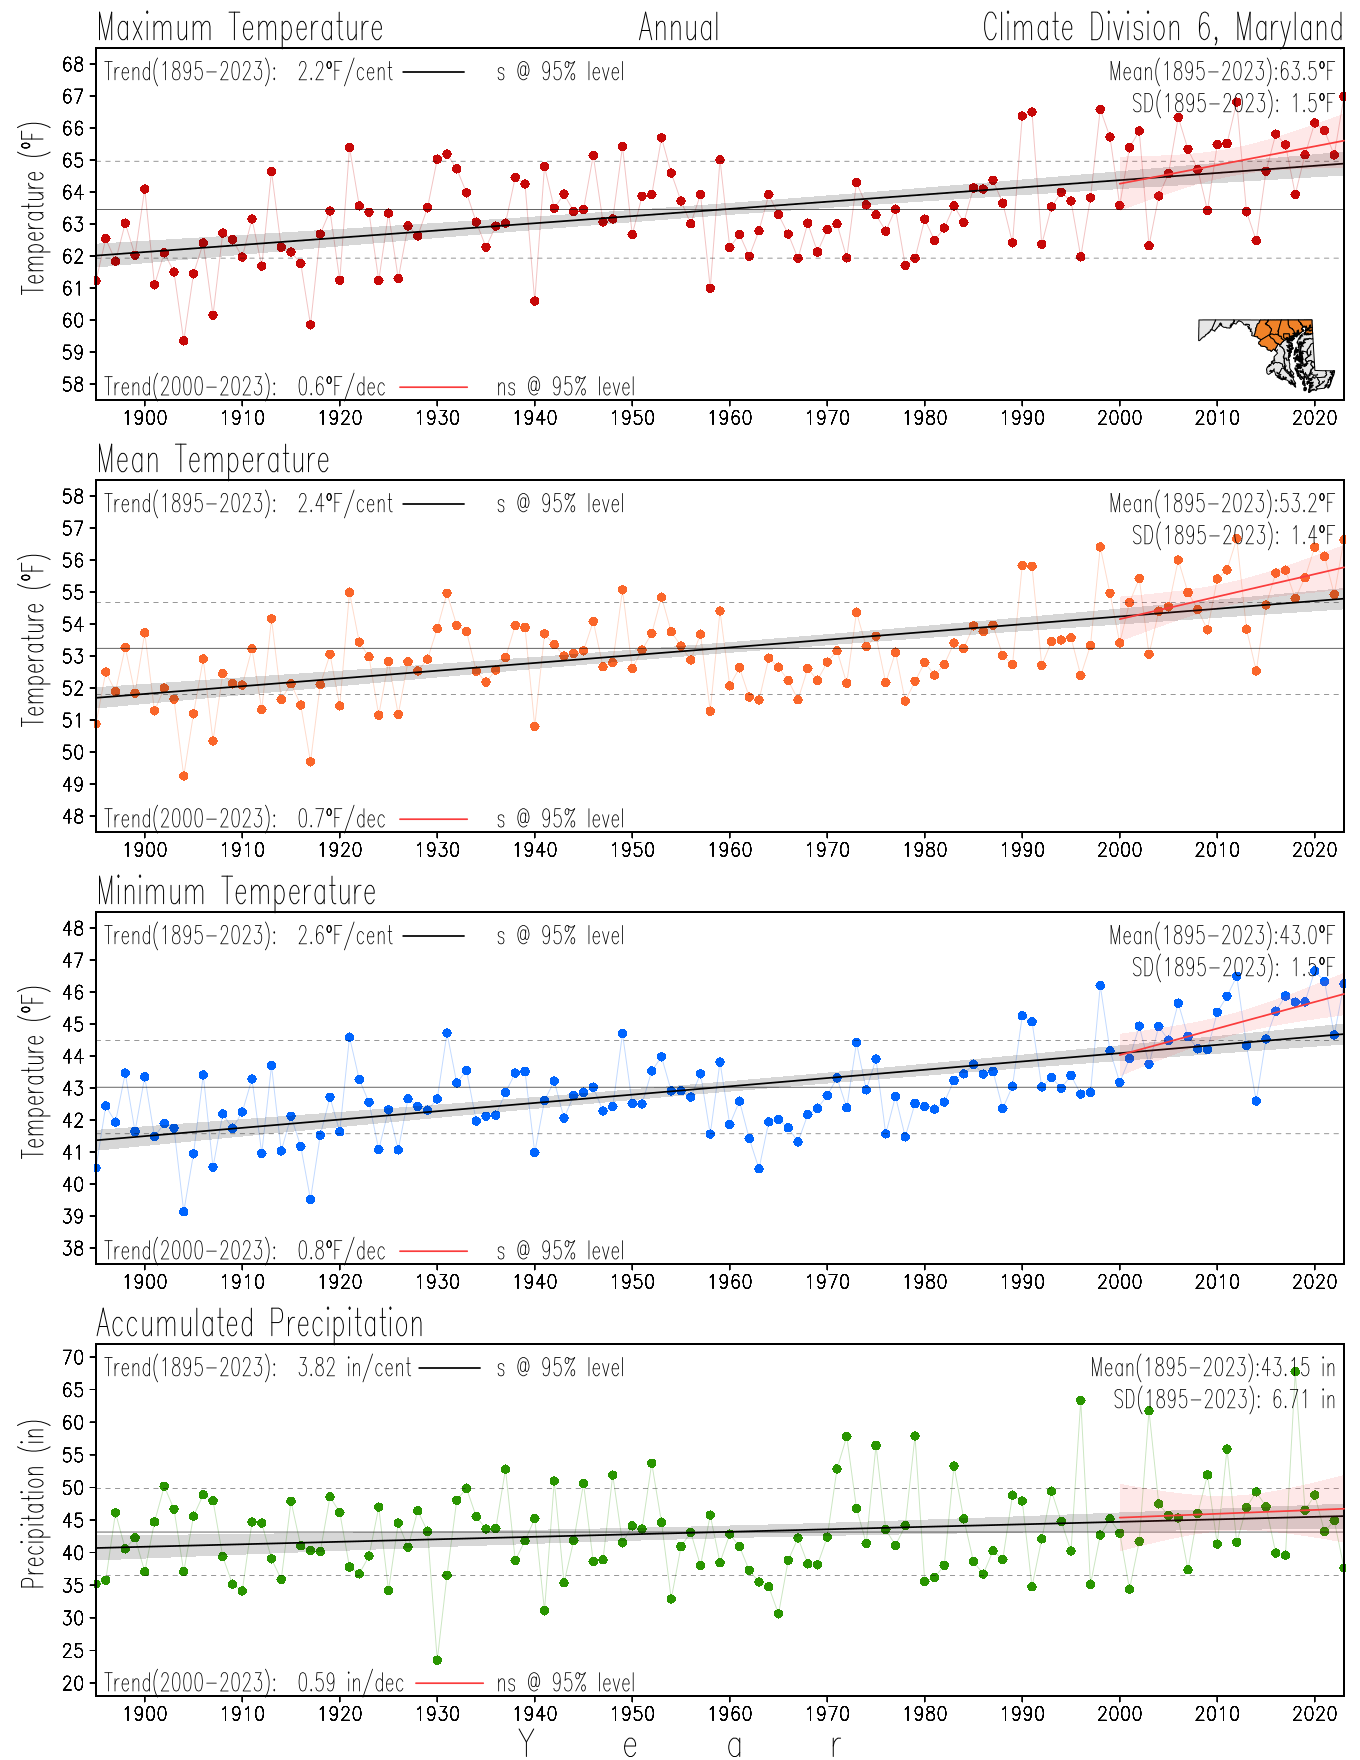
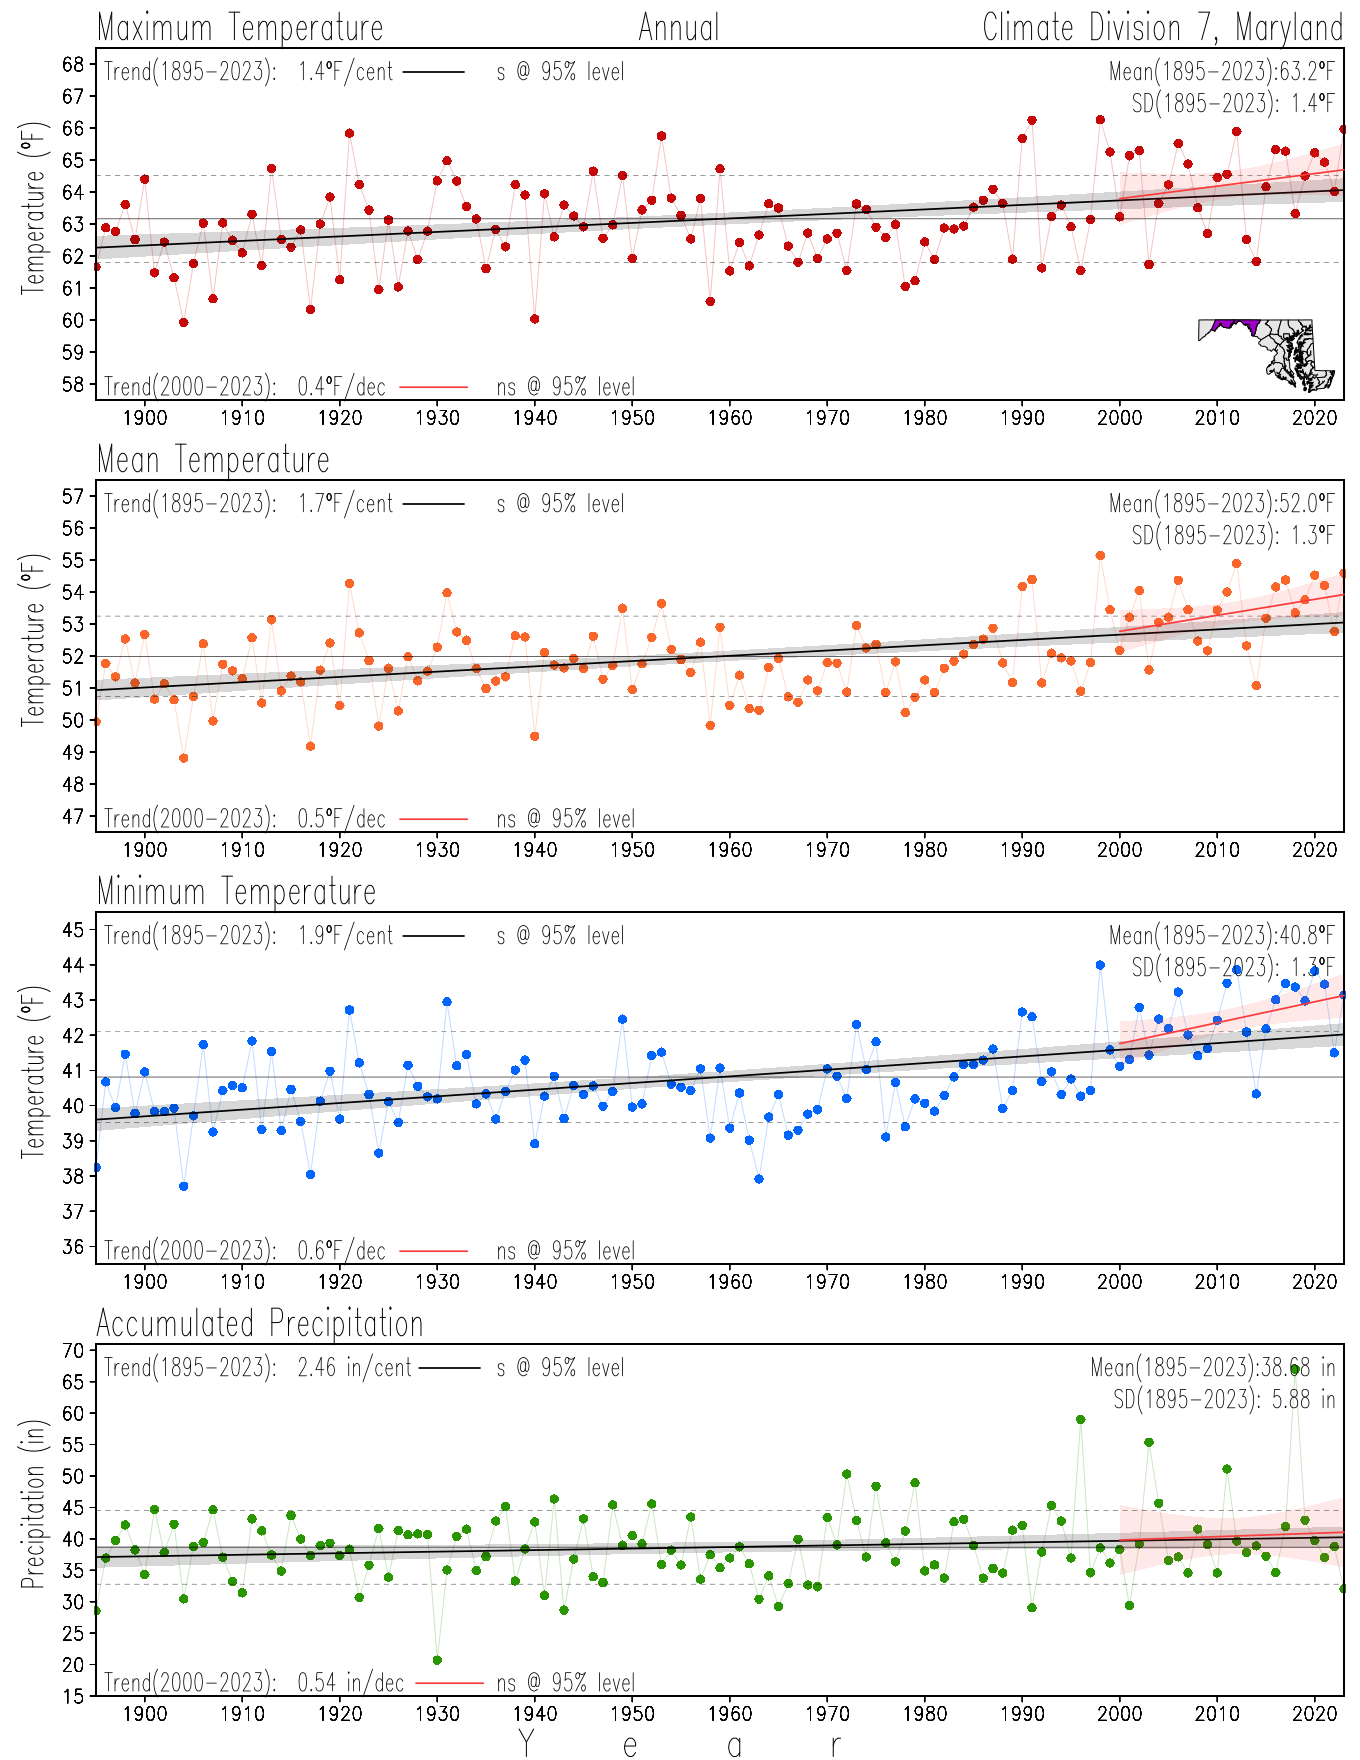
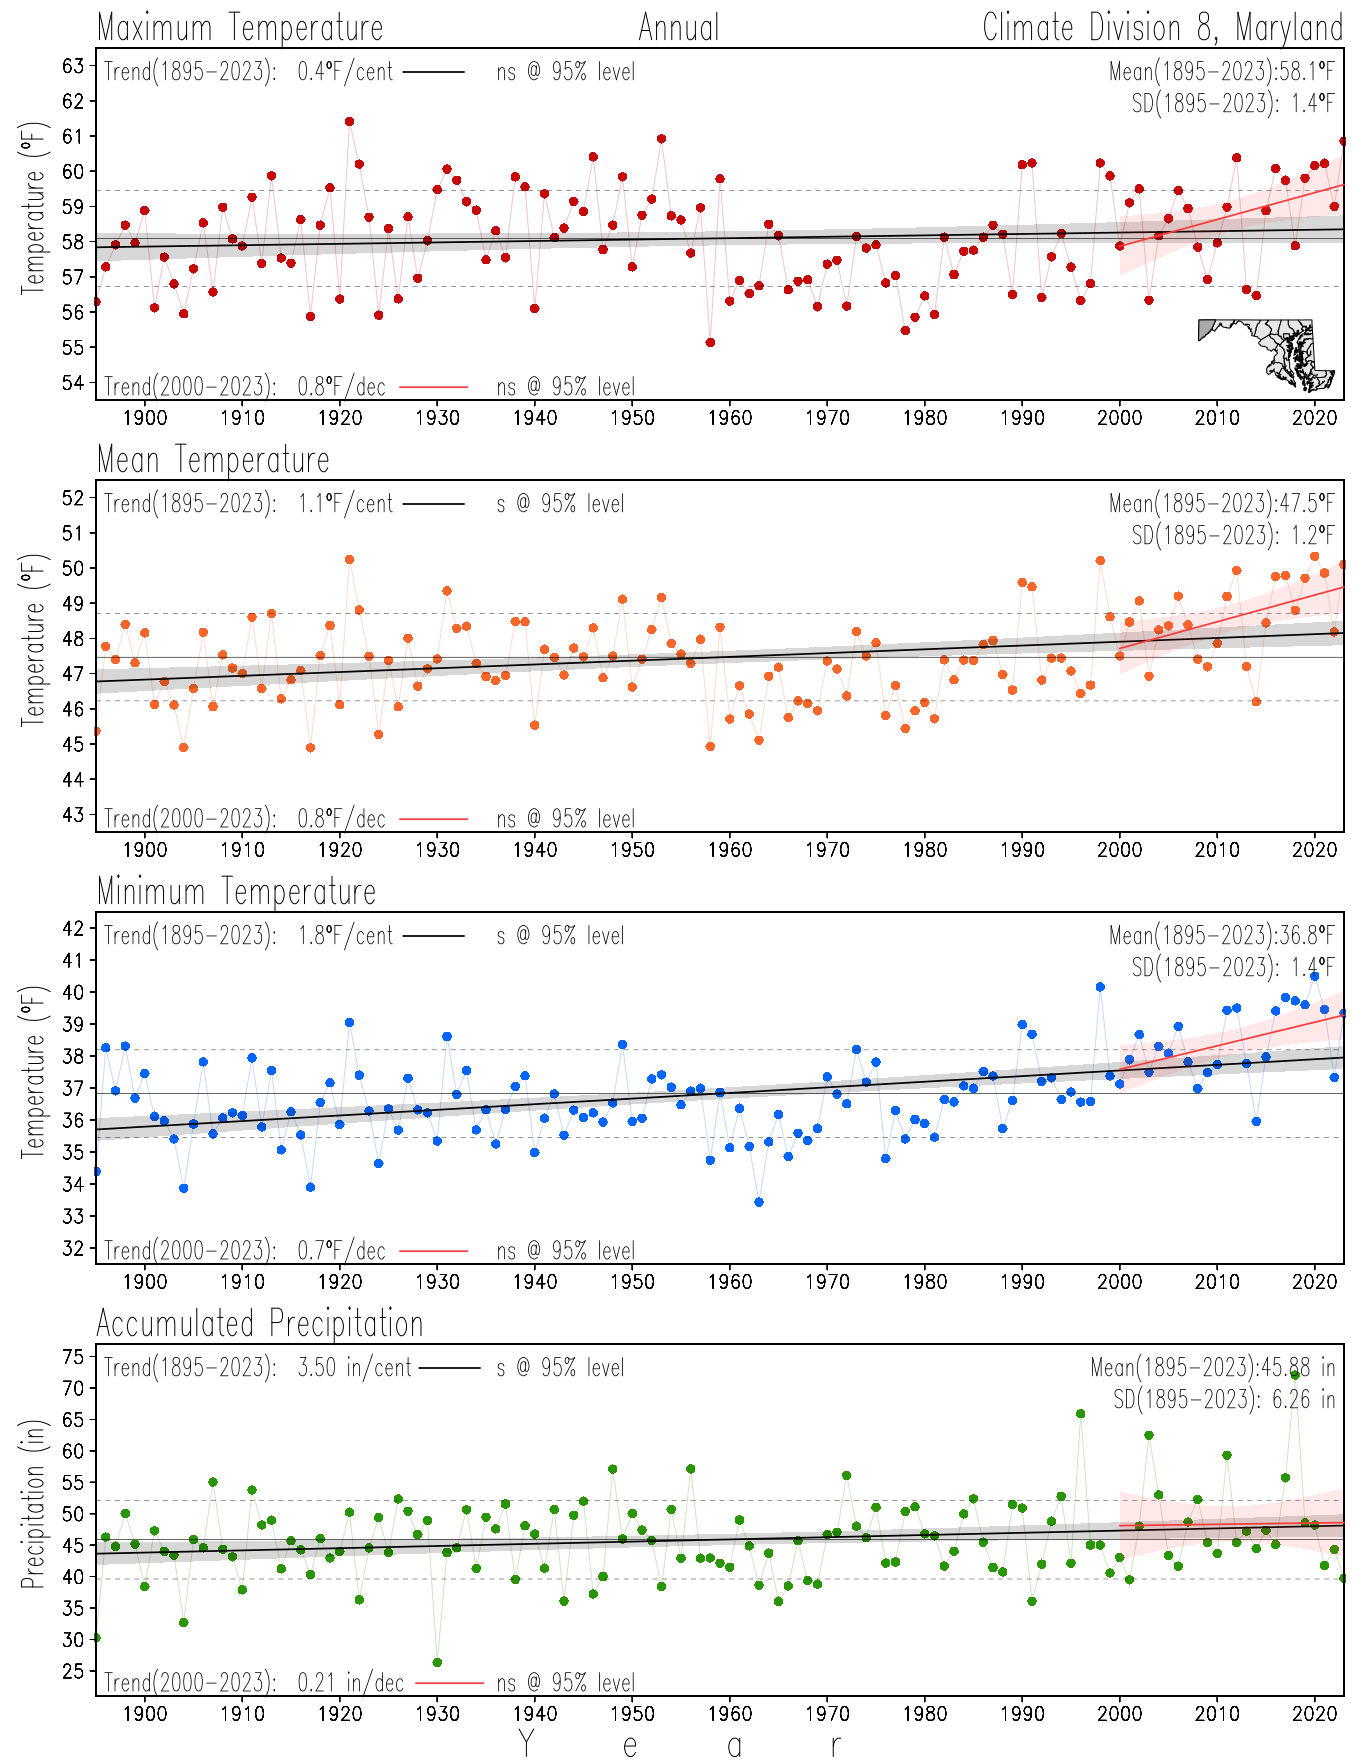
This page directs to the historical temperature and precipitation graphs for Maryland (statewide), its climate divisions and counties where by simple inspection one can identify variabilty at several scales. The data is displayed via area-averaged (i.e., time series) mean, maximum, minimum surface air temperatures and accumulated precipitation at statewide, climate division and county levels at monthly, seasonal and annual resolutions. Seasons are defined following the common three-month meteorological definitions: March, April, and May for spring; June, July, and August for summer; September, October, and November for fall; and December, January, and February for winter. Seasonal temperatures are obtained as the mean of the temperatures in the three months, while seasonal precipitation is obtained as the sum of their values in the three months. Annual temperatures are obtained from the 12-month January to December monthly means, while annual precipitation is obtained from the sum of the 12-month January to December accumulated monthly precipitation.
The data set used in this page comes from NOAA's Monthly U.S. Climate Divisional Database (NClimDiv, Vose et al. 2014). This data set provides surface monthly data over continental U.S. for the period 1895-present, which is used to elaborate the time series at the seasonal and annual resolutions.
NOTE: The clickable panels will open a new page displaying ....
